We break down what’s happening with Ethereum on July 24 and what to expect from ETH▲$1,761.17 in the near term.
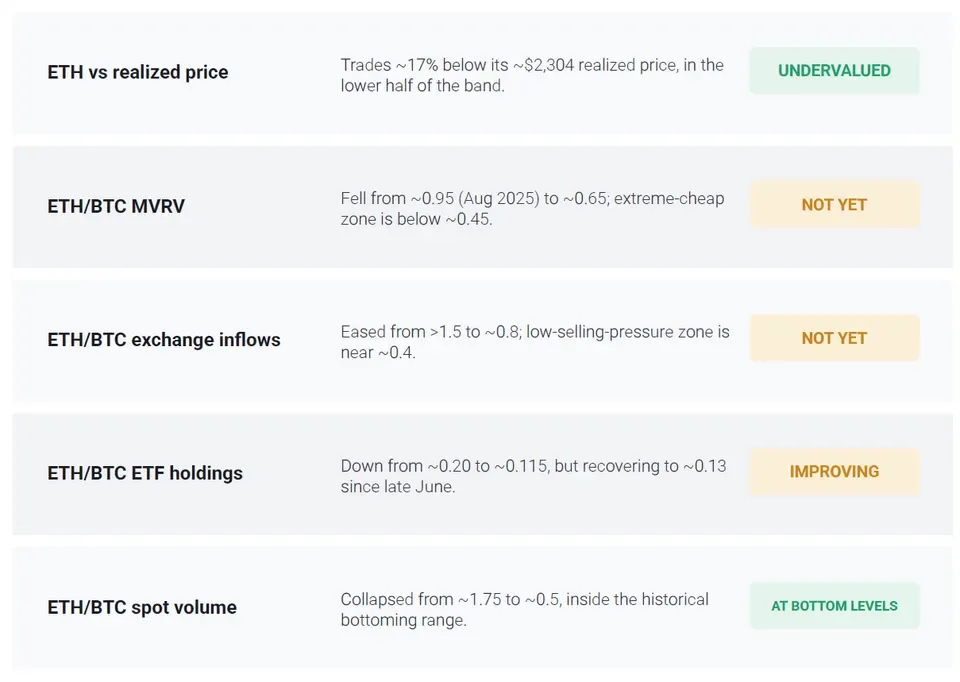
Ethereum (ETH) is flashing on-chain signals typical of market bottoms. According to CryptoQuant, the second-largest cryptocurrency is trading 17% below its realized price–the average cost of all coins in circulation, currently around $2,300. Historically, such periods have indicated undervaluation and a cycle bottom.
Hot topic: Bitcoin’s Jump to $65K Hasn’t Ended the Bear Market — Glassnode
Over the past month, ETH outperformed bitcoin (BTC): +19.7% vs +11.7%, with the asset trading around $1,900. Still, analysts warn that only two of five key metrics have reached previous reversal levels–so a confirmed bottom isn’t in yet.
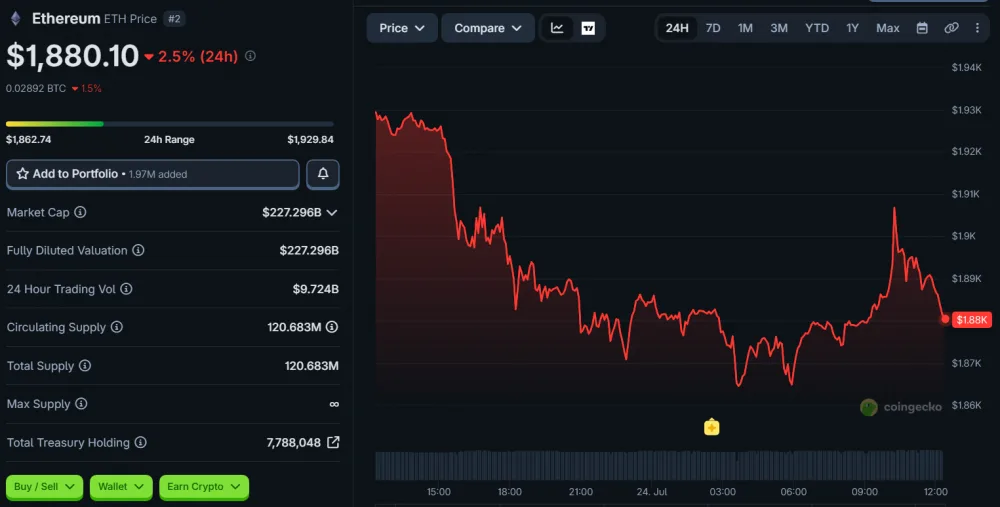
At the time of publication, Ethereum trades at approximately $1,880. The altcoin has fallen 2.5% over the past 24 hours.
Contents
Ethereum vs Bitcoin: Which Signals Point to a Bottom
ETH’s ratio to realized price and relative spot trading volumes have already hit historical levels. The second metric has dropped from roughly 1.75 to 0.5, signaling weaker speculative interest–consistent with past bottoms.
Other metrics are improving but not yet showing final capitulation. Ethereum’s MVRV relative to bitcoin has fallen from 0.95 in August 2025 to 0.65. But in previous bottoms, it dropped to about 0.45.
The ETH/BTC▲$62,630.00 exchange inflow ratio has fallen from above 1.5 to 0.8, suggesting easing sell pressure, though it remains above the 0.4 level seen in past bottom zones.
Read more: Ethereum to $100K? Tom Lee’s Bullish ETH Forecast Sparks Massive Debate: Genius Call or Pure Hype?
Staking and Exchange Outflows: Ethereum Supply Is Shrinking
A record 34% of Ethereum’s supply is now staked. Rising staking reduces the number of coins available for trading, potentially easing sell pressure. In late June, ETH outflows from Binance hit a three-year high, suggesting coins were moving to self-custody or staking rather than preparation for selling.
Ethereum’s share of spot crypto ETF assets also began recovering after nearly a year of decline. The indicator fell from 0.2 in August 2025 to 0.115 in June, then rose to 0.13. CryptoQuant called this the first sign of returning institutional demand–but the current recovery isn’t enough to confirm a trend reversal.
Read more: Ethereum ETFs Are Back — Could Institutional Money Finally Ignite the Next ETH Rally?
Bitcoin and the Macro Backdrop: Pressure on Risk Assets
Bitcoin fell below $65,000 on the night of July 24–a three-day low–as traditional markets weakened. Pressure mounted after renewed Iran tensions: President Trump said Tehran would be held responsible for Houthi attacks on commercial ships. The S&P 500 fell 1.2%, the Nasdaq 2.2%.
Brent crude topped $100 a barrel, raising inflation concerns. US Treasury yields rose, and the probability of a Fed rate hike at the July meeting approached 40%, up from roughly 12% a week earlier.
Traders are divided on bitcoin’s next move. Michaël van de Poppe called $64,000 the nearest support. He said holding above $68,000 resistance would open the path to $73,000.
Learn more: Best 5 Altcoins to Buy Before August 2026 — These Could Lead the Next Crypto Rally