Selling pressure on altcoins hit a five-year high in June and continues to mount. We break down what’s happening in the crypto market on July 3.
The cumulative sell-side volume on the altcoin spot market, excluding bitcoin and Ethereum, hit record highs since data tracking began in 2020, according to CryptoQuant analysts.
The Cumulative Buy/Sell Volume Difference indicator reflects the accumulated gap between buy and sell volumes on major centralized crypto exchanges (CEX).
Hot topic: Bitcoin Tests $62K on Weak US Jobs Data — Short Liquidations Hit $450M
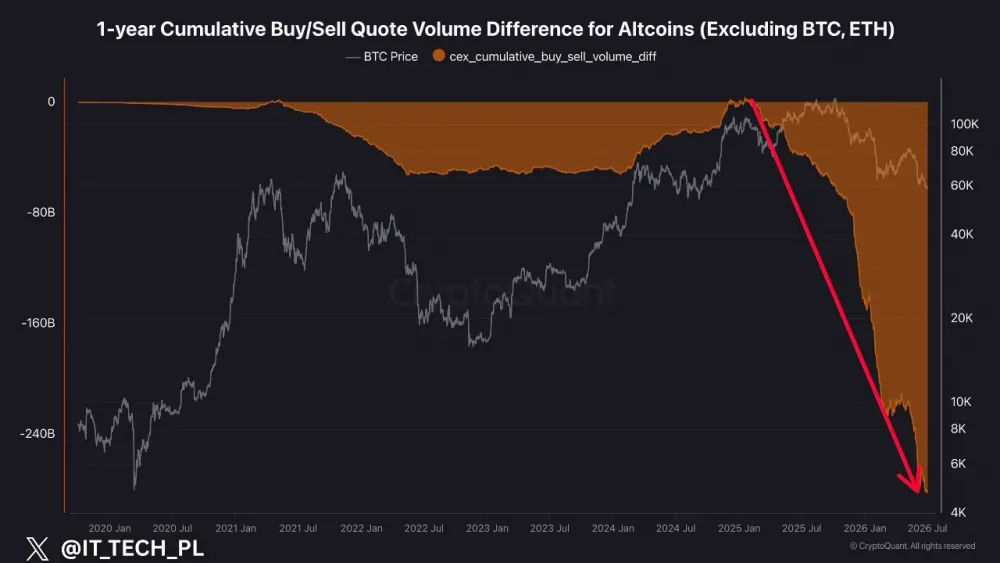
For the past 15 months, altcoin selling has consistently outpaced buying.
“No bounce. No pause. Just distribution. More than 15 months have passed, and there’s still no bottom,” CryptoQuant noted.
Contents
Altcoins Sinking: 82% of Top 100 Closed June in the Red
According to CryptoRank, about 82.1% of the top 100 crypto assets posted losses in June–the weakest market of 2026 so far. Excluding stablecoins, the average gain for the top 100 was 8.9%, but the median return crashed to -16.8%.
The average return stayed positive only because of one token–Velvet, which surged 1,715%. Only a few others showed similar positive performance: LAB▼$6.16 (+116%) and Audiera (+112%).
Read also: 84% of Altcoins on Binance Trade Below 200-Day MA — Will Altseason Ever Come?
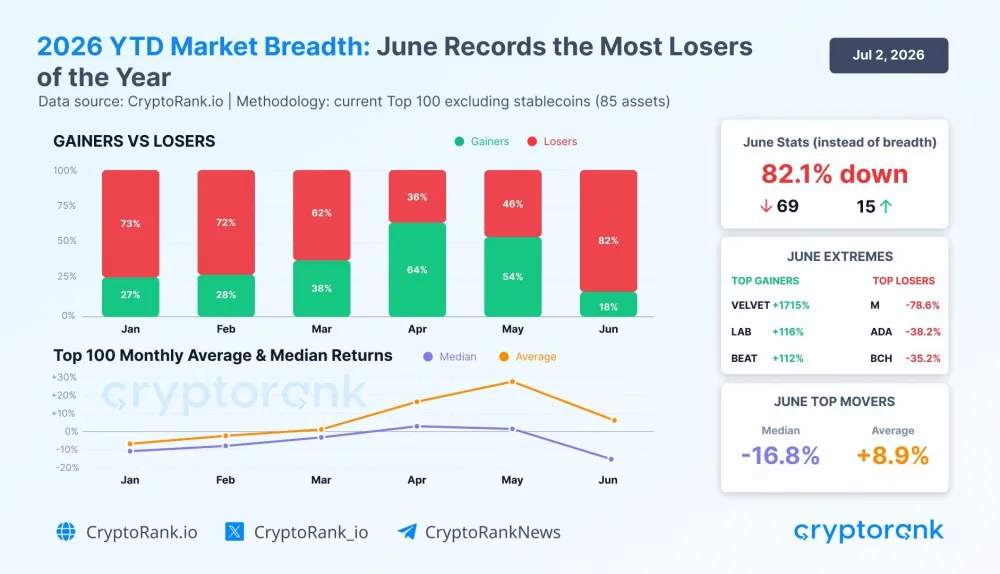
The strong start to the Q2, when 64% of leading altcoins were in the green in April, has been completely erased by summer pessimism. May worsened, and June cemented the negative trend.
The enormous gap between average and median values shows that the vast majority of coins traded under heavy selling pressure.
Read more: Top 5 Altcoins for the Next 100x Crypto – Best Crypto to Buy Now 2026
Bitcoin Dominance on the Verge of a Breakout — What It Means for Altcoins
Bitcoin’s (BTC) market share has fallen to 58.55%, approaching the lower boundary of a range held since August 2025. A decisive break below this level could open the path to 55.5%. Many traders call this the main trigger for a major capital rotation into altcoins.
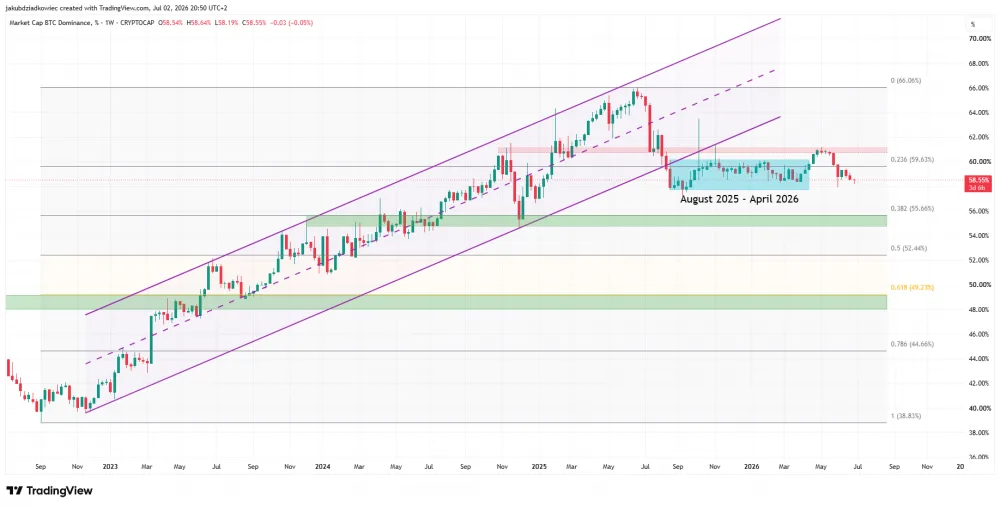
The weekly chart shows a long upward parallel structure dating back to late 2022. In August 2025, bitcoin broke out of the channel for the first time–ending the multi-year trend. In May 2026, BTC.D again tested resistance near 61% but failed to hold above it. It is now trading within the old range and remains below the 0.236 Fibonacci retracement level at 59.63%.
Despite record selling pressure, the key level to watch is BTC.D at 59.63%. A breakout could signal the start of capital rotation into altcoins. But for sustainable growth, altcoins will need a shift in fundamentals and a return of buying demand. In the coming weeks, the market is likely to remain in a zone of uncertainty.
Learn more: The Great Crypto Rotation — Why Capital Is Moving from Memecoins to Utility Tokens