
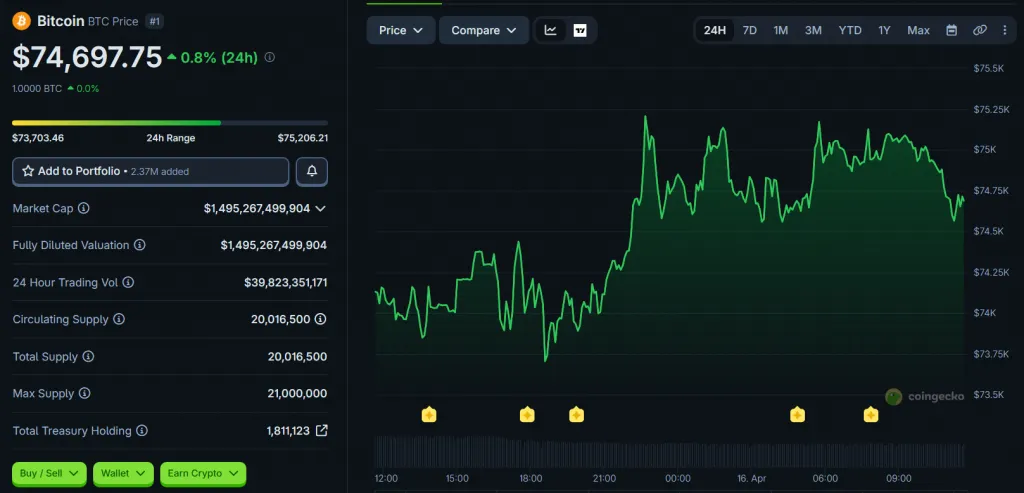
On April 15, bitcoin continued its cautious climb and came close to the $75,000 mark.
At the time of publication on April 16, 2026, the leading cryptocurrency trades around $74,690, showing a gain of approximately 1% over 24 hours.
Related: Top 5 Crazy Bitcoin Price Predictions—Will BTC Hit $1M?
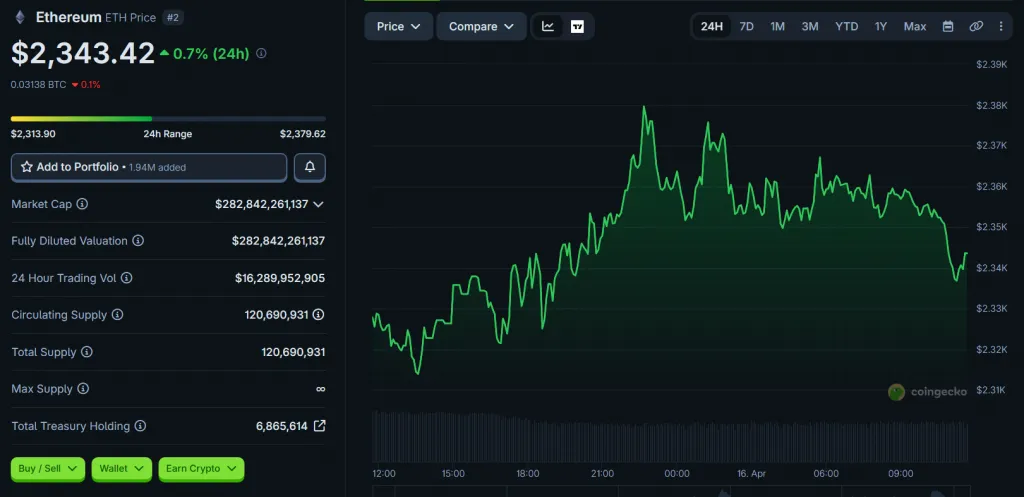
Meanwhile, the second-largest cryptocurrency trades around $2,350. Ethereum (ETH) also showed a modest gain of approximately 1% over 24 hours.
Otherwise, the most capitalized altcoins in the top 10 entered April 16 in positive territory. Only the stablecoins Tether (USDT▲$0.9991) and USDC▼$0.9997 showed no price movement over this period.
Related: Bitcoin Developers Float BIP-361 Plan That Could Freeze 4M Dormant BTC
Contents
What Is Influencing BTC’s Price on April 16?
Investor focus remains on US-Iran negotiations. The second round is scheduled for today, April 16. Media reports suggest a possible two-week extension of the current ceasefire, though Tehran has warned that a blockade of Iranian ships in the Strait of Hormuz could lead to a withdrawal from the agreements.
Brent crude futures fell below $100 per barrel, also supporting the recovery in risk assets.
Market Microstructure
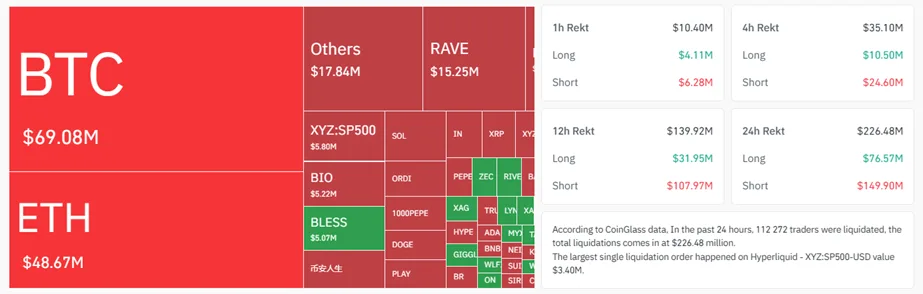
According to Coinglass, shorts totaling $48.7 million were liquidated over the past 24 hours—more than double the $20.4 million in long liquidations.
Related: Best Bitcoin Layer 2 Projects to Watch in 2026
Inflows into spot BTC ETFs reached $186 million, following $411.5 million the previous day.
CryptoQuant analysts recorded a surge in profit-taking by bitcoin holders to $1.14 billion, the highest this year. Meanwhile, coins continue to move off centralized platforms (23,566 BTC over the past seven days), and the amount of USDT on exchanges has grown by $2.8 billion over two weeks.
On-Chain Insights From Glassnode
Glassnode analysts note that bitcoin (BTC) is gradually approaching an important medium-term ceiling—the True Market Mean at $78,100. The current price sits approximately 5.2% below this level.
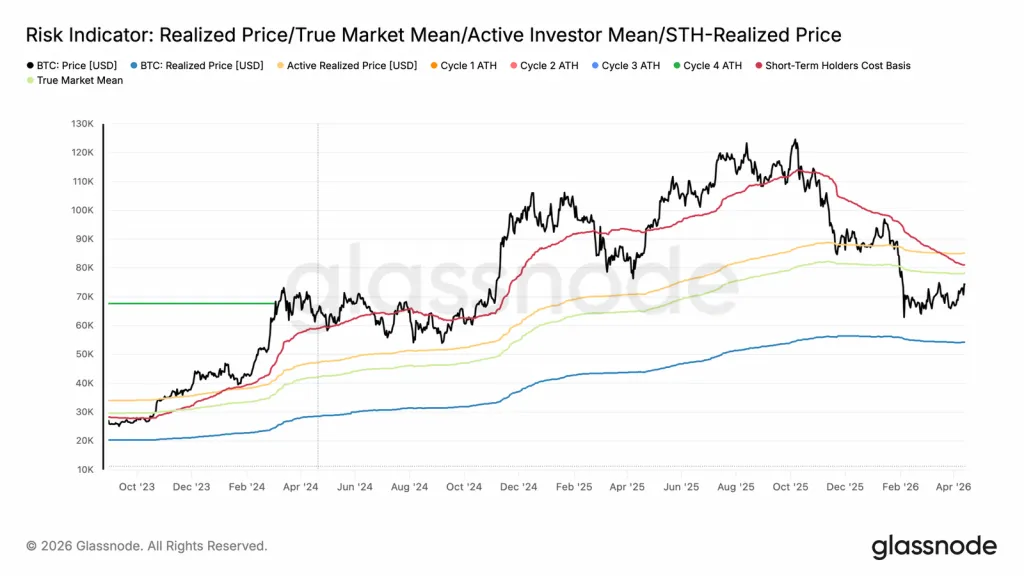
The share of short-term holders in profit stands at 43.2%. That remains below the historical average of 54.2%, where noticeable profit-taking typically begins in bear rallies. This leaves room for further upside but warrants caution as price approaches resistance.
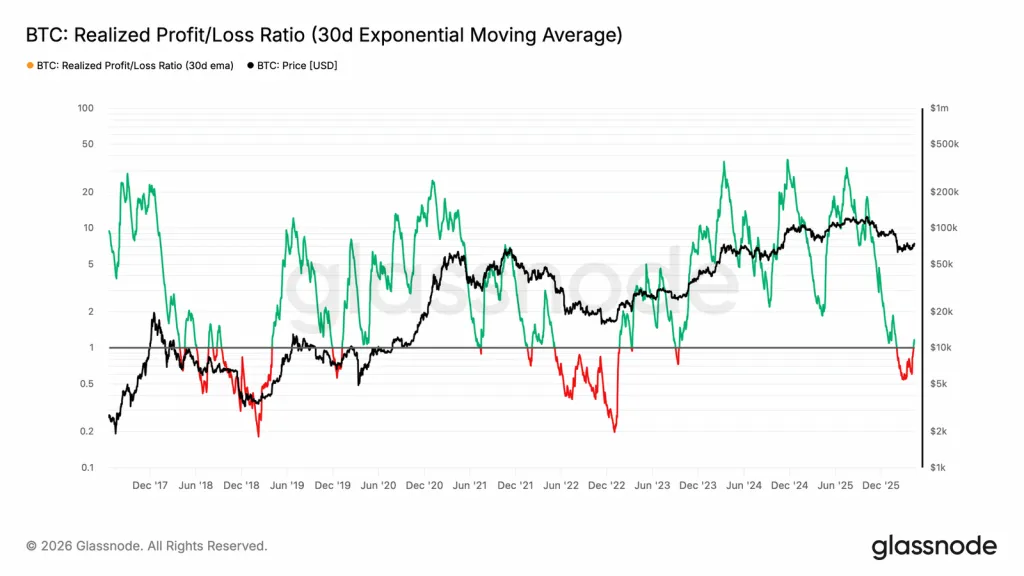
The 30-day moving average of the Realized Profit/Loss Ratio sits at 1.16, indicating profit-taking dominates over loss realization. A strong demand catalyst will be needed to absorb this wave of selling and transition into a full bull market.
Read also: Top 5 Crypto Assets to Invest in April 2026—Best Cryptocurrencies for Maximum ROI