Ethereum price dropping trends remained visible throughout May 2026 as sellers continued defending major resistance levels.
ETH▲$1,761.17 continued to struggle to maintain institutional net inflows above $2,300 as the wider crypto markets fell along with stocks of technology companies.

Contents
Why Is Ethereum (ETH) Price Still Dropping?
Key Macro Factors Pressuring ETH Price
Ethereum lagged Bitcoin over the month and slid roughly 8% over the 30-day period, reinforcing concerns around whether is Ethereum going down further in the near-term, leading to renewed discussion around why is Ethereum price dropping even with broader stabilization across parts of the crypto market.
This broader technical weakness also helps explain why is Ethereum falling while traders continue reducing exposure to risk-sensitive assets, as shown by TradingView data captured daily, confirming the bearish momentum at the medium- and long-term.
Downward price attempts to reclaim the 100 EMA were rejected throughout May, often with little strength in volume, showing a lack of buyers amassing.
| Indicator | Current Signal | Interpretation |
| 50/100/200 EMA | Price below all EMAs | Bearish trend structure |
| RSI (Daily) | Around 41 | Weak momentum |
| MACD | Bearish territory | No confirmed reversal |
| Open Interest | Near cycle highs | Elevated leverage risk |
| Major Resistance | $2,200-$2,300 | Strong seller activity |
| Key Support | $2,050-$2,080 | Short-term accumulation zone |
Ethereum Market Structure Breakdown
The daily and 4-hourly market structures are also bearish, and Ethereum has set a series of lower highs since peaking just above $2,400 in May. Recent sell-offs brought the asset close to its $2,050 liquidity zone, where a small bounce occurred.
However, the rebound never broke through the descending resistance structure, indicating that ETH market structure broke down.
ETH has settled below the entire 4H EMA cluster. Current Ethereum resistance levels remain concentrated near the 50 EMA at $2,104, followed by the 100 EMA at $2,128 and the 200 EMA at $2,214.
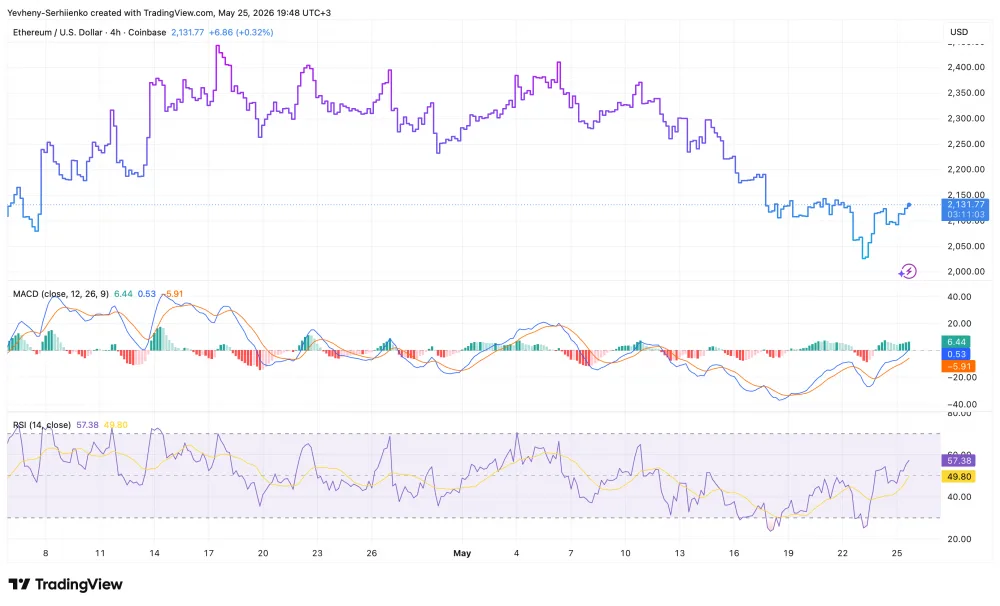
This setup of bearish EMA stacking is usually a continuation signal, especially if the price stays compressed under all major dynamic levels of resistance at this point.
Other indicators are likewise consistent with a downside bias. Daily RSI fell to 41 after an ETH RSI oversold reading near 30 earlier in May, while still staying below the neutral 50 level.
The MACD is in bearish territory on both the daily and the 4H charts, with the recent bullish crossover indicating slowing selling pressure, but no trend reversal.
Ethereum bearish trend remains unless ETH can reclaim the $2,220-$2,300 resistance range with meaningful spot volume supporting it.
ETH Technical Analysis: Current Price Action Breakdown
Major Support and Resistance Levels for Ethereum
Current Ethereum price today analysis still displays a weak bearish structure after the asset repeatedly failed to reclaim the $2,200-$2,220 region throughout May.
According to TradingView, the strongest recent region for accumulation lies between $2,050 and $2,080, where buyers absorbed the most pressure from aggressive selling after the latest downside sweep.
Read Also: Ethereum’s Glamsterdam: A Complete Guide to Ethereum’s Upcoming Upgrade
However, rebounds from that area were weak, as spot participation was limited. Several former supports became resistance as the price rejected off levels like the $2,200 area, which had been short-term support during a brief May consolidation but was confirmed as a supply area with rejection candles.
Above that, there is a high volume node between $2,280 and $2,330 where sellers have been absorbing the upside.
This also means that ETH support and resistance structure remains bearish till Ethereum makes a clean break above.
Psychological liquidity levels remain a source of short-term volatility, with ETH briefly losing the $2,100 handle during the recent correction before quickly snapping back towards the Point of Control around $2,120.
However, price action is still unable to break above the mid-range resistance, and the local bounces have not followed through, validating ETH price breakdown on both the daily and 4H charts.
Trend Indicators and Momentum Signals

The trend indicators are negative on all timeframes. Ethereum is below the 50-day EMA at $2,183, below the 100-day EMA at $2,222, and below the 200-day EMA at $2,298.
Current ETH price chart analysis on the 4H timeframe still shows bearish EMA stacking beneath major resistance zones.
Read Also: Top Ethereum Gas Fee Solutions in 2026: How Cheap Is ETH Now?
This reinforces the downside bias with each attempt to recover being halted below the cluster of EMAs, indicating that sellers are aggressively defending these active resistance levels.
As such, the subsequent Ethereum EMA 50 200 crossover structure still carries continuation risk rather than confirming an established reversal structure.
Momentum oscillators are also weak, with only short-lived attempts at a rebound. Daily RSI, after making an oversold reading earlier in the month, has rebounded to a high of 41, but remains below the neutral 50 level.
Likewise, MACD momentum has shown signs of flattening after a quick bullish crossover attempt that has yet to develop into substantial upside continuation. As such, broader Ethereum price analysis stayed cautious through the final days of May.
Volume Profile and Liquidity Analysis
From the volume profile chart layer below, we can see we have a clear high-volume node at the $2,120-$2,130 region. This is the POC, with a large HVN at the $2,300 level visible. There is also a clear increase in supply pressure at this level, as we see that sellers have been adding constantly during previous price increases.
Spot participation in recovery attempts has also declined during the second half of May, with bounces on lower volumes compared to the selling pressure that led ETH to drop below $2,200 earlier in the month.
Read Also: Why Crypto Whales Are Accumulating Ethereum Again in May 2026
This suggests recent upside was largely driven by short covering and gives greater credence to the bearish reading of more broad-based Ethereum volume analysis metrics.
ETH support levels below the current price action continue looking fragile due to thin liquidity status under the $2,080 region.
Liquidations likely support this view, since following long squeezes, quick declines below key support levels within the day, followed by weak demand around those levels, indicate Ethereum’s bearish outlook over longer time horizons.
Ethereum On-Chain Data Signals Weakness or Accumulation?
Exchange Inflows and Outflows
On-chain flow data indicated that market participants were quite cautious in their longer-term accumulation. CryptoQuant noted a number of spikes involving ETH sent to exchanges throughout May, including during sudden sell-offs close to the $2,050 range.
These deposits coincided with local sell-off patterns and may have been motivated by traders using exchanges to handle exposure or hedge volatility.
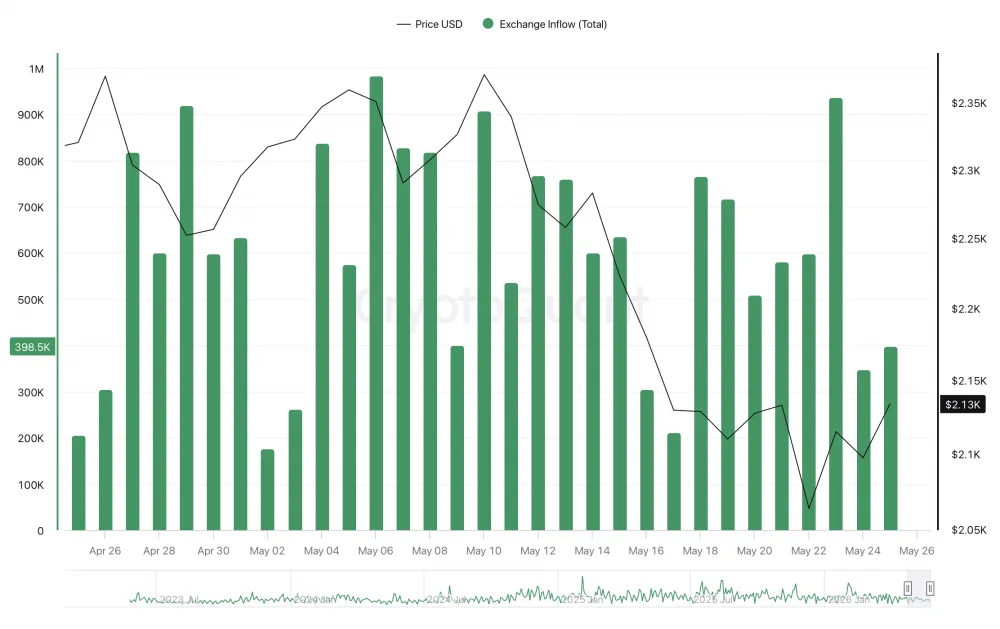
In addition to this declining exchange outflow, ETH withdrawals were also occurring but to a lesser extent than previous recoveries, indicating no clear accumulation pattern.
The largest outflow event late in May came after a series of brief losses under the $2,100 mark, suggesting that selective buyers amassed into sweeps of liquidity rather than in response to trend lines, leaving Ethereum exchange inflow data slightly weighted to the bearish side overall.
Whale Activity and Smart Money Positioning
Another sign of defensive behavior comes from whale transaction behavior. Santiment data show transactions over $100,000 spiking with volatility in early 2026, then flattening in the following downtrend.
If this pattern persists, it generally shows that large players don’t have directional conviction, not aggression.
The general trend mirrors a distribution phase, with large holders looking to amass during deep sell-offs from forced liquidation, but there is little, if any, evidence of meaningful continued accumulation from the whales at current prices. That weaker positioning occurs amid a continued slowdown in ETH-focused whale activity across other on-chain indicators.
Selective accumulation nevertheless persisted on the large liquidity sweeps below $2,100, especially on the large transfer spikes after downside volatility events, suggesting there are still smart-money players who are opportunistically amassing around local panic lows over the following strength during rallies.
Network Activity Metrics
Other Ethereum network indicators have remained more stable. Public on-chain dashboards show about 400 thousand active addresses per day. Growth in new address creation has been relatively flat through May.
This may suggest that user activity is less volatile now and has supposedly plateaued despite dropping gas fees and better Layer-2 infrastructure.
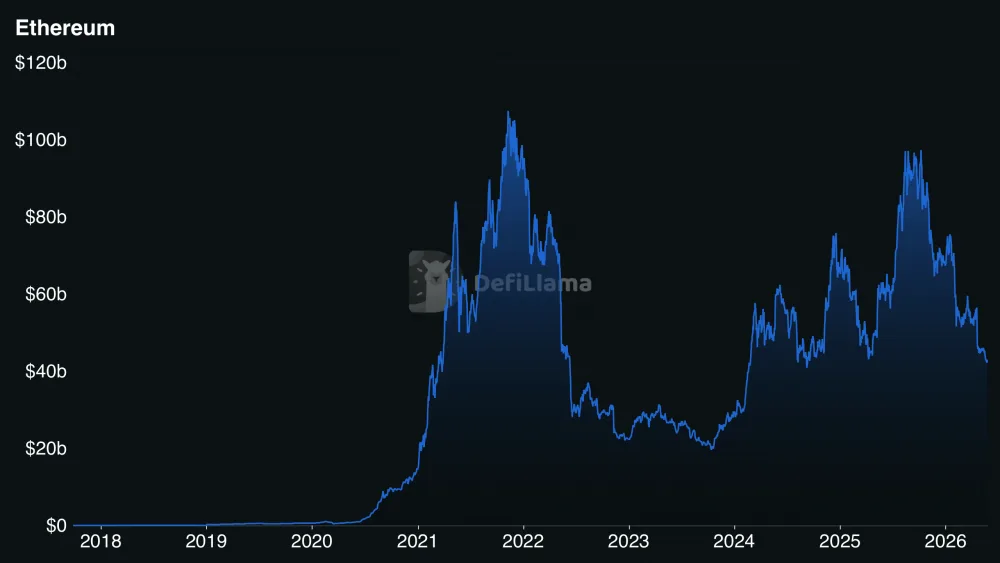
Similarly, DeFi continued to underperform relative to previous cycles, with Ethereum TVL falling from above $100 billion in 2021-2022 to the $40-$50 billion range in May 2026, according to data from DefiLlama.
Broader Ethereum on-chain analysis also shows part of the ecosystem activity continuing to migrate toward Layer-2 sidechains and rollups.
Stablecoin liquidity inside the ecosystem has also failed to produce a large ETH demand impulse: USDT▲$0.9991/USDC▲$0.9999 supply continued to grow throughout Ethereum infrastructure ecosystems, with little to no capital rotation into spot ETH.
Meanwhile, the average gas price has fallen, and evidence from transaction activity indicates demand on the network has not yet returned to bull market levels.
| On-Chain Metric | Current Trend | Market Signal |
| Exchange Inflows | Rising during sell-offs | Potential sell pressure |
| Whale Activity | Flat to declining | Weak accumulation |
| Active Addresses | Mostly sideways | Slowing network growth |
| Ethereum TVL | Below cycle highs | Reduced DeFi activity |
| Stablecoin Liquidity | Growing slowly | Weak ETH conversion |
| Gas Usage | Lower than bull cycle peaks | Reduced network demand |
Derivatives Market Pressure on Ethereum Price
Ethereum derivatives positioning also remains extremely long, despite a relatively weaker spot price. According to data from Coinglass, the ETH open interest remains close to the all-time high of 14 million ETH, even while Ethereum remains far below previous cycles’ peak.
Elevated leverage and weak spot demand remain among the main Ethereum crash reasons discussed across derivatives markets in May.
This also brings to the state of perps today: In the last 24 hours, there have been more than $35 million in ETH liquidated across all perp futures markets, with the majority being long liquidations.
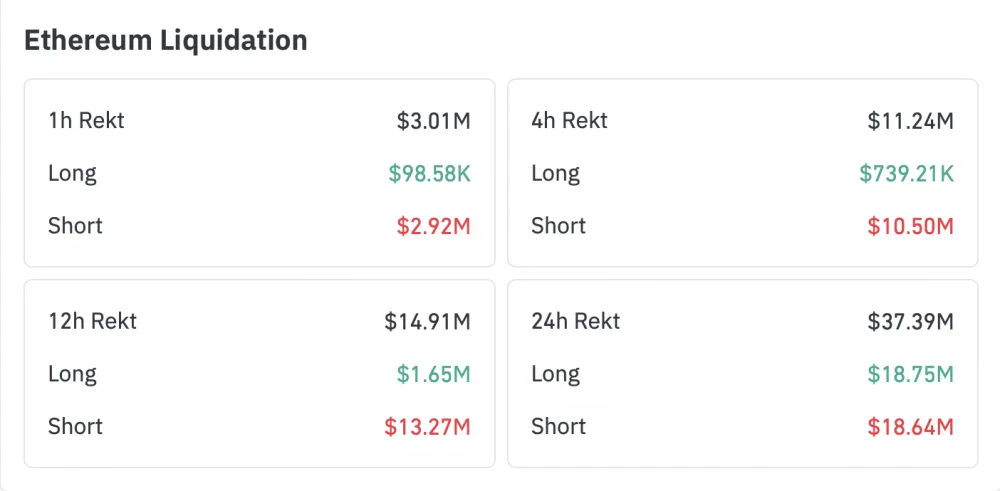
In addition, another major liquidation event after a drop below $2,100 reinforced the cautious ETH market outlook across derivatives markets.
Furthermore, using exchange-level liquidation data, it was shown that Binance had the largest proportion of ETH liquidations throughout downtrends.
When there exists a high open interest as well as a soft spot momentum in the market, a small downward pressure can generate an avalanche of selling orders. This was something that repeated itself many times over the course of May, especially as drops became severe after support lines were passed.
This points to the idea that derivatives positioning has not fully capitulated yet. Although there were multiple points of liquidation, open interest was relatively high, with traders still building out leveraged positions on moves higher, rather than aggressively deleveraging positions.
That said, short-term ETH price prediction models remain vulnerable to renewed volatility if Ethereum fails to reclaim the important $2,200-$2,300 resistance zone.
FAQ
Is Ethereum still in a bearish trend?
Ethereum’s technical picture remains weak as prices remain below key resistance levels and moving averages, and bearish conditions are expected to continue across the cryptocurrency market until ETH regains footing above these recent breakdowns.
Why is Ethereum facing such acute liquidations?
The derivatives market currently has very high leverage. Thus, leaving ETH vulnerable to volatility spikes and triggering further selling through forced liquidations across futures exchanges when critical support levels are broken.
Are whales currently buying Ethereum?
On-chain data suggests this accumulation was in the form of selective buying during sharp drops, as large holders appear to continue cautious and react to volatility rather than build directional exposure.
Can lower gas fees rescue Ethereum?
Cheaper transactions improve usability and support network activity over time. However, lower fees alone are not enough to trigger a sustained price recovery without stronger demand and wider market confidence.