Ethereum has just issued one of the most dreaded technical signals in crypto trading: a rare weekly death cross. The bearish setup came as ETH▲$1,761.17 price dropped, ETF flows turned negative, and the broader market failed to show much bullish momentum. On July 9, 2026, Ethereum was trading around $1,625, while Bitcoin (BTC▲$62,630.00) hit $62,826.

The crucial question is whether Ethereum’s weekly death cross is a sign of things to come or merely a reflection of the price action that has already happened. Death crosses are indeed bearish, but they can be misleading, especially when the downtrend appears to be nearing its end.
Related: Bitcoin and Ethereum in Crisis: Can Solana Become the Main Global Payments Network in 2026?
Contents
- Ethereum Just Formed a Rare Weekly Death Cross
- What Does History Say About Ethereum's Previous Death Crosses?
- Why Did Ethereum Print a Weekly Death Cross Now?
- Could Ethereum's Death Cross Trigger a Broader Crypto Sell-Off?
- What Are Analysts Saying About Ethereum's Outlook?
- Key Indicators to Watch After the Death Cross
- Is the Weekly Death Cross a Buying Opportunity?
- FAQ
Ethereum Just Formed a Rare Weekly Death Cross
What Is a Weekly Death Cross?
A weekly death cross is a bearish technical indicator that appears when a shorter weekly moving average crosses below a longer one. In Ethereum’s case, traders are watching out for the 50-week EMA crossing the 200-week EMA to the downside. According to a recent analytics report, Ethereum confirmed a weekly death cross for the first time in years.
The bearish signal suggests that ETH’s medium-term momentum is turning lower. As a result, the death cross becomes a bearish signal for Ethereum. However, a daily death cross is more common, and traders usually disregard it due to its frequent appearance.
Why This Signal Matters More Than a Daily Death Cross
As mentioned above, a daily death cross is relatively common and less significant than its weekly counterpart. A weekly death cross rarely appears, and when it does, it often triggers a sizeable downtrend. The reason is simple: it takes months for the 50-week EMA to move below the 200-week EMA, so the signal rarely appears in a vacillating market.
Therefore, traders must take Ethereum’s weekly death cross seriously, although it might already be too late to profit from the short-term sell-off. To confidently act on the bearish signal, traders must look at on-chain data, volume, ETF flows, and price action.
When Was Ethereum’s Last Weekly Death Cross?
Ethereum’s last weekly death cross was several years ago, and the latest technical setup has sparked debates about whether it was the first in years. It is hard to say for sure, as some technical analysts use simple moving averages (SMA), while others utilise exponential moving averages (EMA). What is apparent is that Ethereum’s weekly death cross is a rare market occurrence, not a regular technical setup.
What Does History Say About Ethereum’s Previous Death Crosses?
How ETH Performed After Earlier Weekly Death Crosses
Ethereum death crosses have been appearing in bear markets, and they often coincide with the price’s significant drawdowns. In other words, the lower the price is, the higher the chances are that ETH will cross below the long-term moving average. In fact, bearish momentum often accelerates after the death cross, especially if the price struggles to hold critical levels.
This is not to say that every weekly death cross is a bearish sign for Ethereum, but history shows that such technical setups usually contribute to the ongoing downtrend. Therefore, traders should be especially wary of the bearish breakout if the price starts printing lower highs and lower lows on a weekly chart.
Related: Ethereum ETF Update: Could Staking ETFs Become ETH’s Biggest Catalyst?
Cases Where the Signal Correctly Predicted Further Losses
The most straightforward scenario is when the price remains below the key moving averages, so any failed attempt to reverse the downtrend simply results in new lower lows. The death cross becomes a reliable bearish signal if volume picks up after the crossover and the funding rates remain negative.
According to a recent report, analysts were watching out for ETH’s critical support at $1,150. If the bears managed to push the price below this level, the next target was the lowest BTC/ETH ratio in history. Naturally, such an outcome would not be a confirmation of the bear market, but it would certainly contribute to the ETH price forecast.
When a Death Cross Failed as a Bearish Indicator
A death cross can fail to predict further losses if the bears have already dumped their supply at lower prices. If the price holds critical support levels and the funding rates improve, Ethereum will be able to reverse the downtrend. This is precisely why some analysts believe that a weekly death cross is not a reliable indicator for the short-term ETH price forecast.
In reality, the weekly death cross is not a bullish signal for Ethereum. However, if the price action and on-chain data indicate that the bears are exhausted, the technical setup can provide a valuable entry point for longs.
Why Did Ethereum Print a Weekly Death Cross Now?

Weak Price Momentum and Technical Breakdown
The most apparent reason why Ethereum printed a weekly death cross is that the price failed to hold bullish momentum. ETH’s price action simply did not allow the 50-week EMA to remain above the 200-week EMA, as the price struggled to print higher highs and higher lows on a weekly chart.
This is the most common reason why death crosses appear in crypto markets, especially after weeks or months of failed attempts to reverse the downtrend. As a result, traders must pay close attention to the price’s behaviour around the critical levels.
ETF Flows and Institutional Positioning
Another plausible reason why Ethereum is printing a weekly death cross is because of the ETF inflows/outflows. According to Farside research data, ETH ETFs had a challenging end to June 2026, as there were several days of consecutive net outflows.
However, the bears’ pressure began dissipating in early July, with the product experiencing net inflows on July 1, July 2, July 6, July 7, and July 8, 2026. Naturally, Ethereum ETF inflows/outflows are not the primary driver of the price action, but they can confirm the bears’ grip on the price.
Macroeconomic and Regulatory Headwinds
Ethereum’s weak performance in early July 2026 can also be explained by macroeconomic and regulatory risks. The crypto market remains highly sensitive to macroeconomic news, especially when it comes to interest rates, the dollar’s performance, liquidity, and regulatory developments.
In Ethereum’s case, regulatory news can be particularly important, as ETH is a network with smart contract functionality. As such, ETH price forecast must consider the DeFi adoption rate, staking demand, Layer-2 solutions, ETF inflows, and regulatory clarity surrounding crypto assets.
Could Ethereum’s Death Cross Trigger a Broader Crypto Sell-Off?
How Bitcoin Typically Reacts to Ethereum Weakness
Bitcoin is often the first crypto asset to respond to weakness in the broader market. If Ethereum weakens while Bitcoin holds its ground, funds may roll over to BTC or stablecoins. However, this dynamic depends on how Bitcoin price action treats its critical levels.
Bitcoin also struggled to hold the $64,000-$65,000 resistance area as Ethereum printed a weekly death cross. As such, Bitcoin’s weakness is also a crucial factor in the crypto market’s bearish outlook.
What This Could Mean for Altcoins
Ethereum’s weakness is usually a bearish sign for the altcoin market. In many ways, ETH plays the role of a bellwether for the crypto market, so its weakness often precedes a broader sell-off. In fact, many altcoins are simply leveraged versions of Ethereum, so their liquidity can dissipate rapidly when the market turns bearish.
A bear market in altcoins rarely appears out of thin air. It is usually the result of a failed leadership rotation, where Bitcoin and Ethereum weaken simultaneously, and funds rotate back to stablecoins. Naturally, a weak Bitcoin or Ethereum can trigger a broader crypto sell-off, depending on the asset’s role in the ecosystem and the overall market capitalisation.
Key Levels Traders Are Watching Across the Crypto Market
In Ethereum’s case, traders are watching out for the price’s behaviour around the $1,500 level, with a higher probability of further losses if the bears manage to push the price below this level. For Bitcoin, the critical area is the low $60,000 level, and the bulls’ ability to hold it will determine the short-term price action.
The most crucial factor for the crypto market’s short-term outlook is the bears’ ability to push the price below critical levels. If the bears manage to create a bearish breakout with increased volume, their control over the price will be close to certain. At the same time, a bullish breakout can derail the bears’ short-term momentum.
Related: Top 5 Wild Ethereum Price Predictions for 2026: From Realistic to Moonshot Scenarios
What Are Analysts Saying About Ethereum’s Outlook?
Bearish Scenarios
The bearish ETH price forecast is built around the simplest technical setup: a weekly death cross. The bears argue that Ethereum’s weekly death cross is a confirmation that the long-term downtrend is in place. As such, the bears will look to exploit the technical setup to sell ETH at higher prices before the price drops further.
The ETH price target for the bearish scenario is well below $1,500, which would allow the bears to capitalise on the increased supply at this level. Furthermore, the bears will look to utilise the weak demand from ETFs and institutional investors.
The bearish case for Ethereum is built around the price’s failure to hold higher prices and weak on-chain demand. The bears argue that the technical setup rarely appears in a vacillating market and that the weak weekly momentum is a sign of an impending downtrend.
Bullish Counterarguments
The bullish ETH price forecast is based on the simplest argument: a weekly death cross is not always a reliable indicator of the price’s short-term prospects. The bulls argue that the bears have already sold off a substantial amount of ETH, so the bears’ exhaustion is likely to drive the price higher.
The ETH price target for the bullish scenario is much higher, as the bulls can capitalise on the bears’ supply at lower prices. Furthermore, the bulls will look to utilise the ETF inflows and institutional demand to create a bullish breakout.
The bullish case for Ethereum is built around the weekly death cross appearing too late in the downtrend to serve as a reliable indicator. Moreover, the bulls note that demand from ETFs and institutional investors can help the price hold critical levels.
On-Chain Metrics That Could Confirm the Next Trend
Glassnode’s report highlights several on-chain metrics that can help determine the trend in the crypto market. In particular, the 111-day, 200-day, and 200-week moving average set acts as a reliable indicator for medium-term and long-term trends.
The report also notes that the confluence of flow data and wallet metrics can provide additional insights into the market’s direction. As such, investors must watch out for supply-demand imbalances, stablecoin flows, exchange inflows/outflows, and on-chain transaction fees.
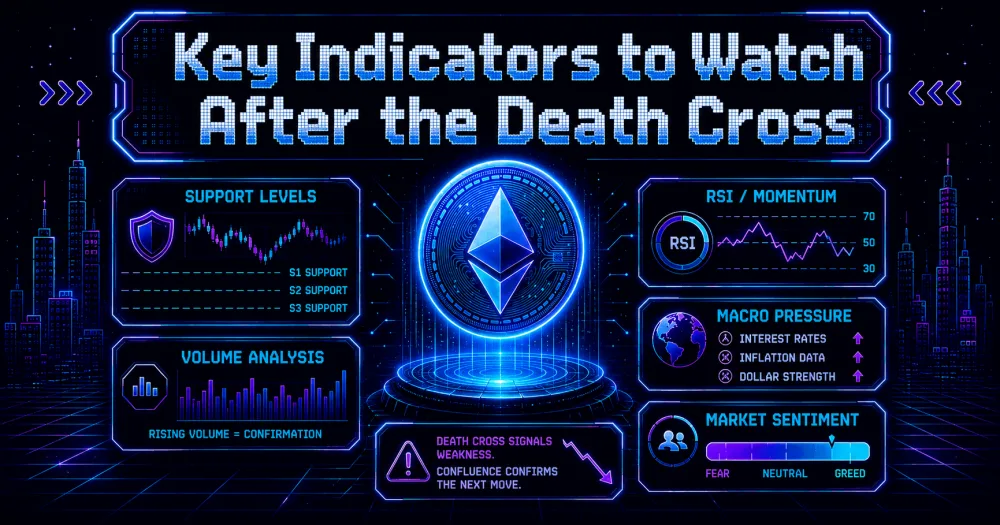
Key Indicators to Watch After the Death Cross
Trading Volume and Momentum
Trading volume is one of the most important indicators to watch for after a death cross, as it can help determine the strength of the downtrend. In particular, a death cross that appears during a period of high volume is more likely to be reliable than a death cross that appears during a period of low volume.
Momentum indicators can also provide valuable insights into the short-term price action. In particular, Relative Strength Index (RSI), Moving Average Convergence Divergence (MACD), and Average Directional Index (ADX) can help determine whether the bears have enough strength to push the price lower.
Ethereum ETF Inflows and Outflows
Ethereum ETF inflows/outflows are another critical factor to watch for, as they can determine whether institutional investors are bullish or bearish about the ETH price forecast.
According to Farside’s report, Ethereum ETFs had a challenging end to June 2026, as there were several days of consecutive net outflows. However, the bears’ grip on the price appears to be weakening, as there were several days of net inflows in early July 2026. As such, Ethereum ETF inflows/outflows can be a crucial factor in determining the short-term price action.
Open Interest and Funding Rates
Open interest (OI) is another critical indicator for determining the short-term price action. In particular, OI can help measure the strength of the longs and shorts, which can be especially important in perpetual futures trading.
Funding rates can also provide valuable insights into the market dynamics, as they indicate whether longs or shorts are paying higher fees to the opposite side. As such, negative funding rates can lead to short liquidations, while positive funding rates can encourage longs to close their positions.
Exchange Reserves and Whale Activity
Exchange reserves are an essential metric for determining whether bears are accumulating supply. In particular, rising exchange reserves can indicate that bears are preparing to sell larger amounts of ETH in the near future.
Whale activity is also an essential metric to watch for, as whales can significantly impact the price by selling or buying large amounts of ETH. As such, investors must watch out for whale activity, especially around critical price levels.
Is the Weekly Death Cross a Buying Opportunity?
How Long-Term Investors Interpret the Signal
Long-term investors often utilise technical analysis to time their entries, but their approach to a weekly death cross is usually different from day traders’. In particular, long-term investors can take advantage of the weekly death cross by dollar-cost averaging into ETH.
The most crucial consideration for long-term investors is the risk/reward asymmetry of their trades. As such, long-term investors should only buy ETH if the risk of losses is lower than the potential reward.
The main danger for long-term investors is buying ETH at a local price peak, as it can lead to substantial losses if the price drops rapidly. As such, long-term investors must utilise stop-loss orders and position sizing to ensure that their risk-reward asymmetry is always skewed towards higher rewards.
Read more: Ethereum to $100K? Tom Lee’s Bullish ETH Forecast Sparks Massive Debate: Genius Call or Pure Hype?
Risks of Catching a Falling Knife
A falling knife scenario usually appears when investors try to buy ETH at a local price bottom only to witness the price drop even lower. Naturally, buying at a falling knife is an exceptionally risky endeavour, especially for leveraged investors.
The most crucial consideration for investors who want to buy ETH at a falling knife is to utilise proper risk management tools. In particular, dollar-cost averaging can help mitigate the risk of buying at a local price peak. At the same time, stop-loss orders can help prevent leveraged investors from suffering devastating losses.
The most apparent risk of buying ETH at a falling knife is the danger of buying at a price bottom only to see the price drop even lower. As such, investors must always utilise risk management tools when attempting to buy ETH at a falling knife.
Historical Performance After Major Technical Sell Signals
Technical sell signals rarely provide actionable insights into the price’s short-term prospects. In most cases, technical sell signals only confirm that the bears have enough strength to push the price lower. As such, investors must utilise additional market indicators to determine the price’s short-term prospects.
The most crucial consideration for investors who want to profit from technical sell signals is to determine the likelihood of a downtrend continuation. In particular, investors must watch out for trading volume, exchange inflows/outflows, ETF inflows/outflows, and on-chain activity. If these indicators improve, technical sell signals can provide valuable entry points for longs.
The most crucial consideration for investors who want to profit from Ethereum’s technical sell signals is to utilise additional market indicators to confirm the bears’ strength.
FAQ
What Is a Weekly Death Cross?
A weekly death cross refers to a bearish technical signal formed by a shorter weekly exponential moving average (EMA) crossing a longer weekly EMA below. Traders speculate that in Ethereum’s case, the 50-week EMA will cross below its 200-week EMA.
Has Ethereum Printed a Weekly Death Cross Before?
The bearish weekly cross is rare for Ether, with the last occurrence being described as the first in years. Moreover, the timing may be different for the two EMAs. Analysts consider various moving average settings when predicting a possible bearish crossover.
Is a Death Cross Always Bearish?
A death cross is usually a bearish signal because it confirms the short-term bearish trend. However, it is also a lagging indicator, meaning that it often appears too late in the trend.
Could Ethereum’s Death Cross Affect Bitcoin?
If Ether’s death cross emerges, it will have a lesser impact on Bitcoin directly. However, this technical signal bears negative implications for the altcoin sector, overall crypto trading volume, and risk appetite. At the same time, Bitcoin is likely to withstand the sell-off to a greater extent than other cryptocurrencies.
Should Investors Sell ETH After a Death Cross?
Sellers should consider their risk tolerance and position size in line with their personal preferences and market outlook. Factors to watch out for include macroeconomic flows, alternative investments’ appeal, exchange reserves, futures open interest, and on-chain activity. However, a death cross is not an outright bearish signal for Ether.