Bitcoin touched $78,300 this morning before pulling back. The leading cryptocurrency is up 2.5% over 24 hours.
At the time of publication on April 22, 2026, bitcoin (BTC) trades at approximately $78,000. Earlier this morning, it briefly reached $78,300 before retreating.
The 24-hour low stood at $74,852, with a high of $77,726. Overall, the coin has risen 2.5% over the past day.
Related: Strategy Bitcoin Holdings Rise After Buying 34K BTC with $2.5B

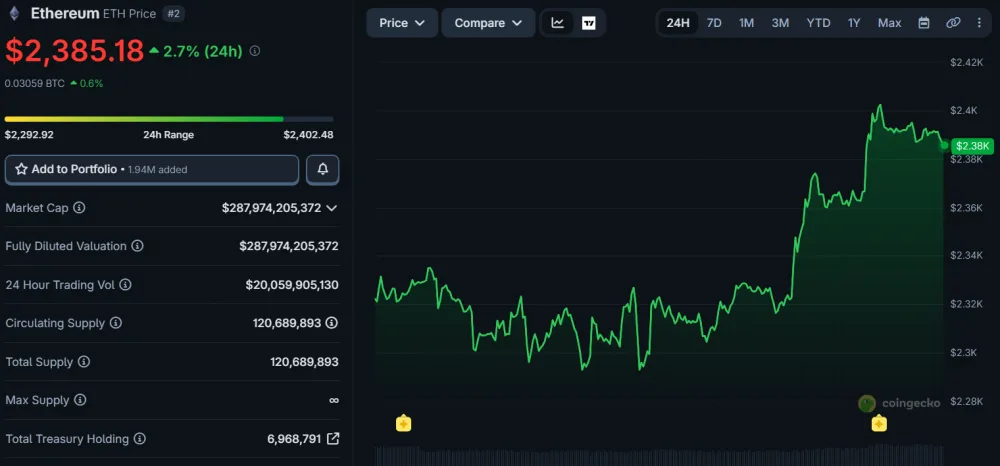
The second-largest cryptocurrency also started the day with gains. Ethereum (ETH) has risen more than 3% over the past 24 hours. At the time of publication, ETH▲$1,761.17 trades at approximately $2,400.
Among the top 100 coins, MemeCore shows the best daily performance, up 32.89%, and weekly performance, up 58.93%. DeXe posted the largest daily loss at -11.39%. LayerZero saw the largest weekly loss at -17.04%.
Read also: BitMine Buys 101,627 ETH for $235M
Contents
What Is Driving BTC’s Price on April 22?
Investor focus remains on US-Iran relations. Direct talks in Islamabad have broken down, but Donald Trump announced a continuation of the ceasefire.
Iran has ruled out sending a delegation until the blockade of the Strait of Hormuz is lifted. No new escalation has occurred.
Read more: Scammers Demand Bitcoin and USDT for Passage Through Strait of Hormuz
Brent crude futures remain just below the psychological $100 per barrel level.
How Is the Broader Market Feeling?
According to Coinglass, short positions in bitcoin faced $168.7 million in liquidations over the past 24 hours, while long liquidations totaled $43.2 million.
Inflows into spot BTC ETFs continued for the sixth consecutive day but slowed to $11.8 million.
The Fear and Greed Index remains in fear territory at 32 points.

Analyst Estimates and Forecasts
Coinbase Institutional noted the lack of firm arguments for a new trend but acknowledged an improvement in bitcoin’s microstructure: selling pressure has eased.
Read also: Bitcoin vs El Salvador—How the Country’s BTC Investment Strategy Changed in 2026
Glassnode suggested a short squeeze could occur. Funding rates in derivatives turned negative in April 2026 despite spot prices hitting new highs.
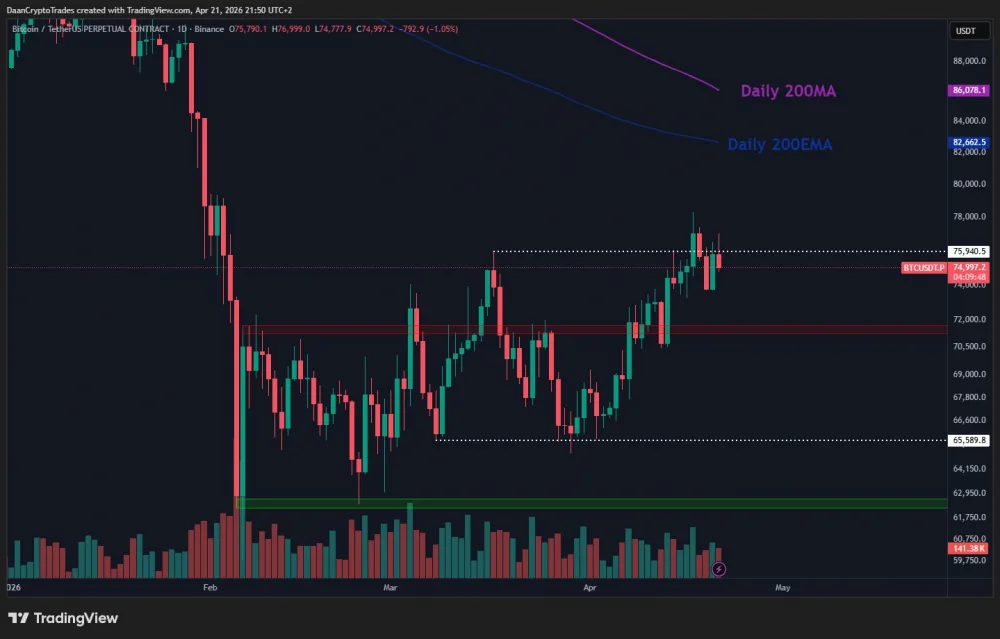
Trader Daan Crypto Trades highlighted unfilled gaps on CME above the current price near $77,000 and $84,000. The 200-day moving averages at $82,660 (exponential) and $86,080 (simple) act as additional magnets. Prices holding just below the March peak indicate relative market strength, but no confirmed trend has emerged.
Related: Will Bitcoin Hit $100K in 2026?