
The Relative Strength Index (RSI), developed by J. Welles Wilder Jr., is one of the most popular momentum indicators used in the cryptocurrency market and helps answer the question of what is RSI for beginner traders.

Contents
What Is RSI in Crypto Trading?
RSI (Relative Strength Index) Explained in Simple Terms
The RSI gauges price momentum on a scale of 0 to 100. Traders use this to determine if an asset has been overbought or oversold.
RSI represents the ratio of the recent upward trend to the recent downward trend over a 14-candle period. Values above 70 are considered overbought, and values below 30 are considered oversold.
Due to the crypto markets’ volatility, RSI is widely used by technical analysis crypto strategies to recognize areas of possible reversal.
Why RSI Matters for Crypto Traders
Due to drastic price movements on a minutes’ timescale, momentum analysis tools such as RSI can help infer when bullish (overbought) or bearish (oversold) momentum is coming to an end.
However, the indicator is rarely used on its own because of potential false signals, which elicits questions about how accurate is RSI in crypto trading during volatile conditions. Nonetheless, it is used to time short-term market reactions.
Another reason RSI is so popular is its broad use in RSI in crypto trading across multiple strategies and timeframes. Scalpers, day traders, swing traders, and countless crypto RSI strategy implementations use the indicator as it can be used across all time frames.
Read Also: Best Crypto Exchanges 2026: Top 5 Platforms for Easy, Safe & Profitable Trading
Many traders will also use additional indicators, such as moving averages, support levels, and volume indicators, to back up RSI signals. Analysts often caution against using RSI levels alone because trends can persist for extended durations.
RSI vs Other Momentum Indicators (MACD, Stochastic)
Although RSI is classed as a momentum indicator, like the MACD and the Stochastic Oscillator, it is a momentum indicator since it measures the strength of price action as compared to a MACD that uses two different moving averages to indicate changes in a trend.
The Stochastic is a more sensitive indicator because it compares the closing price to a recent range of prices, which can result in a larger number of false signals. As a result, some traders prefer the RSI to avoid noise in a fast-moving market.
Professional traders often do not use RSI alone; instead, they couple it with other indicators, such as MACD, moving averages, or volume, in examples of crypto trading indicators explained through practical market analysis.
| Indicator | Main Purpose | Strength | Weakness |
| RSI | Momentum strength | Easy reversal signals | False signals in trends |
| MACD | Trend direction | Strong trend confirmation | Slower reactions |
| Stochastic | Momentum speed | Fast entries | Noisy in volatility |
How RSI Works in Technical Analysis
The 0–100 RSI Scale Explained
RSI is graphically represented as a line that fluctuates between the 0 and 100 marks, indicating the velocity of price movements in a market. The indicator is customarily calculated over 14 periods and responds to buying and selling pressure. Values above 50 suggest bullish momentum, while values below 50 suggest weakness.
To traders, values above 70 are usually seen as overbought and values below 30 as oversold. This gives traders an immediate signal of possible price reversal or correction. Because of its simplicity, the RSI is often first taught using the standard 0 to 100 scale when explaining how to read RSI indicator values.
More experienced traders may consider different ranges, as RSI may remain in overbought or oversold conditions for longer periods during directional trends.
Overbought and Oversold Zones
The RSI is widely used to identify overbought readings when it is above 70 and oversold readings below 30. These levels are thought to signal an exhaustion of the buying or selling trend, and are typically used in most markets as RSI overbought and oversold levels.
As bullish/bearish divergences on the RSI indicator are not a guaranteed reversal signal, a strong trend in crypto markets may remain overbought/oversold for quite some time.
The RSI is therefore frequently used in conjunction with moving averages, support and resistance levels, and other technical analysis tools.
What RSI Divergence Means in Crypto Markets
RSI divergence occurs when the indicator trends in the opposite direction of the price. In a bullish divergence, the market makes a lower low while the RSI makes a higher low. A bearish divergence occurs when the price reaches a higher high, but the RSI fails to do so.
Traders generally believe that divergence is one of the more reliable price reversal indicators because it can sometimes anticipate a change in momentum before the price has changed direction. Traders using an RSI divergence strategy crypto will look for confirmation with volume, candlestick patterns, or support and resistance levels.
| RSI Level | Market Signal | Typical Interpretation |
| Below 30 | Oversold | Possible bullish reversal or rebound |
| 30–50 | Weak Momentum | Bearish or neutral market structure |
| 50–70 | Bullish Momentum | Buyers remain in control |
| Above 70 | Overbought | Potential exhaustion or pullback |
How to Use RSI for Entry Points
Buying When RSI Is Oversold (Below 30)
Further, many traders look at the RSI crossing below the 30 level as a potential buying opportunity since the RSI has long been used to indicate oversold conditions: after strong price action driven by selling pressure, momentum may be waning, and a price move upward may be approaching.
However, oversold conditions do not necessarily lead to a price reversal. In a strong downtrend, it is not unusual for cryptocurrencies to remain oversold for extended periods of time. Because of this, technical analysis traders generally wait for other indicators to confirm RSI entry and exit points.
Short-term traders may use an oversold RSI alongside bullish candlestick patterns and rising trading volume to increase the chances of a price reversal, showing how to use RSI in crypto trading more effectively.
RSI Divergence as a Buy Signal
A bullish RSI divergence occurs when the price creates a lower low, but the RSI creates a higher low. This indicates that the downtrend is losing strength, but is not necessarily reversing. Divergence is frequently viewed by traders as an indication of a potential reversal.
In crypto markets, divergence signals are often judged by higher timeframes, as lower timeframe charts can be noisy. Analysts may prefer to wait for price confirmation, as divergence by itself is not sufficient to guarantee price reversal.
The indicator is popular for advanced RSI divergence strategy crypto setups, as traders look for signs of waning downside momentum before the trend reversal.
Combining RSI with Support Levels
Any trader tries to further improve the entry in an RSI-based trade by combining the RSI with key support levels. Approaching the oversold area at a support level may increase the chances of success and help traders understand how to spot buy signals that crypto markets may produce.
Instead, it prevents bad setups due to the randomness in price movements. It uses momentum and chart structures as an entry signal only if they provide a high confidence signal, and not only when there is an oversold price action. Using the RSI with support and resistance crypto analysis delivers a better entry.
Moving averages and trendlines are also frequently compared with RSI to confirm bullish or bearish trends, and remain common components of modern-day swing trading crypto strategy models.
How to Use RSI for Exit Points
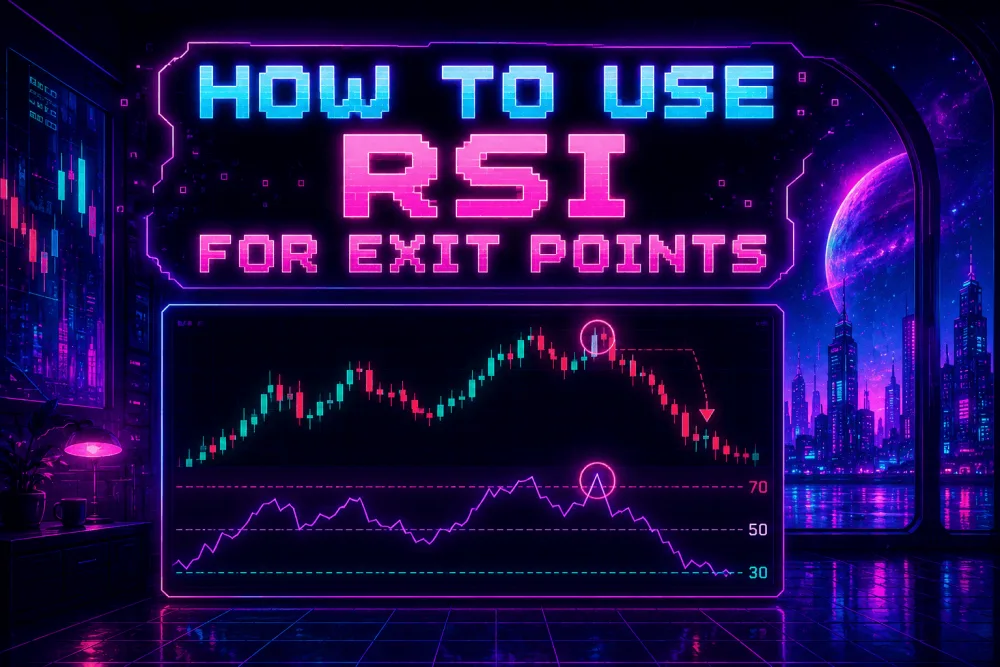
Selling When RSI Is Overbought (Above 70)
Many traders use RSI above 70 as a signal to reduce or close a position, lock in profits, or avoid entering into a position, especially if the price has increased rapidly.
However, RSI overbought conditions alone should not serve as the sole basis for sell signals. For example, in strong bull markets, cryptocurrencies can remain in overbought territory for a long time above the level of 70, so sellers often use price action analysis in addition to RSI.
Read Also: P2P Trading Safety Guide 2026: How to Avoid Fraud, Secure Transactions, and Trade with Confidence
Some traders also scale out of their positions to reduce their exposure and maintain some exposure should that uptrend continue.
Identifying Weak Momentum Reversals
Another signal that RSI can give is when upward momentum is slowing before a price downtrend has started. This is when the price is making higher highs and the RSI is producing lower highs, which is known as bearish divergence.
Weak momentum signals become more important around resistance areas or in parabolic market conditions, where RSI divergence, in addition to a drop in volume or bearish candlestick pattern, is a typical confirmation used in wider trend analysis crypto strategies.
However, analysts tend to wait to get confirmation from the rest of the market before closing large positions, and reversals may not happen immediately.
Using RSI to Lock in Profits in Volatile Markets
In the highly volatile crypto markets, traders often consider RSI for stop-loss trades to protect their unrealized profits against bear markets. When the RSI is in extreme overbought or oversold territory during high volatility, traders can set a tighter stop loss or take partial profits.
This method is especially useful in fast-moving altcoin markets, where momentum can reverse rapidly after a large price movement and distort RSI buy and sell signals. Traders can filter out ineffective RSI buy/sell signals in volatile markets by factoring in volume and support and resistance levels.
Some short-term traders use RSI on multiple timeframes to avoid exiting a trade too early in case the trend is strong.
Best RSI Settings for Crypto Trading
Default RSI (14) vs Short-Term Settings (7–10)
The default period of 14 in the basic RSI calculation was first proposed by J. Welles Wilder Jr. and remains most extensively used due to its overall balance of sensitivity and smoothing throughout various market conditions.
Short-term traders may reduce the inputs for the indicator to 7 to 10 periods to reduce the lag and to get more immediate signals when very short-term price action takes place, but this increases noise and false signals.
To find the best RSI settings for crypto trading, one must consider the timeframe, market volatility, and chosen trading strategy.
Scalping vs Swing Trading RSI Strategies
Scalpers will generally use lower period RSIs, in combination with 1- or 5-minute candlestick charts, to take advantage of the fast shifts in momentum during high volatility. In these situations, the RSI is often used with volume estimates and short-term moving averages to increase the trade’s precision.
Swing traders usually look at daily or 4-hour price charts for larger price patterns, and they also look for stronger confirmation signals like RSI divergence or support and resistance levels in their swing trading crypto strategy.
Because of these factors, crypto RSI strategies are often more appropriate for scalping. Trading the RSI on longer time frames will usually require adjusting the RSI period, based on market volatility and holding period.
How Market Volatility Affects RSI Accuracy
However, high volatility can also cause the RSI to stay in overbought or oversold levels for a long time during major market rallies or sell-offs, and limit its effectiveness.
This is one reason why RSI is seldom used in isolation during price trends. RSI can be coupled with trend analysis, support and resistance levels, or moving averages to filter false signals and improve the odds of success in momentum indicator trading strategies.
Signal strength among different cryptocurrencies may vary depending on market conditions. Large-cap coins like Bitcoin usually have less RSI volatility than illiquid altcoins, where fast price fluctuations cause more false signals.
Common RSI Trading Mistakes
Relying on RSI Alone Without Confirmation
One of the biggest mistakes beginners make is trying to use RSI as a stand-alone trading strategy. RSI is great for spotting momentum reversals, but it doesn’t take market structure, volume, and key levels of support and resistance into consideration.
Because of this limitation, many professional traders use RSI in conjunction with trend lines, moving averages, and price action confirmation to improve trading signals crypto setups. The use of indicators in conjunction tends to provide more favorable signals in a crypto setup than does RSI.
Ignoring Strong Trends (RSI Can Stay Overbought/Oversold)
In crypto, new users sometimes think that prices must fall or rise if RSI enters overbought or oversold territory (above 70 or below 30), but most trends last long enough for RSI to remain there.
Read Also: Essential Crypto Trading Metrics: Top 10 Indicators for Crypto Traders
This was seen in some bullish trends, during which Bitcoin and most major altcoins reached new peaks despite high Relative Strength Index levels, and in panic-driven market sell-offs. However, macro trend analysis is often neglected in the crypto space, resulting in premature positions.
Overtrading Based on Small RSI Movements
An additional mistake is acting upon minor RSI movements because smaller timeframes are much more susceptible to momentum changes that may not have any meaningful market effect.
A main possible disadvantage of using non-confirmed, or weak, RSI signals is overtrading and the resultant increase in transaction costs, which can affect emotionally unstable traders and those who use short-term scalping indicators crypto setups.
Many traders further filter false entries using stronger RSI moves and volume, price structure, or confirmation of higher timeframe price action.
RSI Trading Strategy Examples in Crypto
Simple RSI Reversal Strategy
A common RSI strategy is to try to predict a price reversal when the indicator crosses the oversold/overbought thresholds. A trader may wait for the indicator to cross below 30, and then look for the price to move sideways and cross above the threshold once more, as momentum has been building.
The RSI trading strategy is very popular among many traders because it is easy to understand as part of a beginner crypto trading guide. They generally avoid weak bounces and combine RSI signals with a candlestick pattern and support or resistance.
Conversely, if the stock rises on overheated momentum, it may suggest a bullish exhaustion point in the market when the RSI exceeds 70.
RSI + Moving Averages Strategy
Traders also use the RSI with moving averages, where the moving averages are used to indicate the general market trend, and the RSI is used to find swings or momentum shifts within that trend.
For instance, traders may only take long trades if the price is above a major moving average on that day and the RSI has left oversold levels, avoiding trading against the trend. For its rigor, this combination of moving averages and RSI is a common approach in spot and futures contracts.
RSI Divergence Strategy in Bull and Bear Markets
Divergence may be a possible signal for momentum reversal. Bullish divergence occurs when a price makes lower lows, and the RSI begins to rise, possibly signaling weakening selling pressure. Bearish divergence occurs when the price makes a new high while the RSI fails to.
Divergence is able to be used by traders in a bull market to locate pullback reversals. It can also be used to identify weakening momentum in a bear market. This makes the RSI divergence strategy crypto approach especially useful when cycles are volatile.
Limitations of RSI in Crypto Markets

False Signals in High Volatility Conditions
The intrinsic crypto market’s volatility can cause RSI to generate false signals regarding impending market reversals, as prices can fluctuate quickly enough to trigger the overbought or oversold conditions multiple times in quick succession.
Read Also: Top 5 Crypto Trading Setups for Quick Gains: Boost Short-Term Performance
Because of this issue, it is a common practice to confirm RSI readings with volume or structure on the chart, especially in lower timeframes where the fast pace can create a lot of noise in the market.
Lagging Nature of RSI
Like all technical indicators, RSI is based on past price data. This makes the RSI a lagging indicator, meaning that the indicator reacts to moves that have already occurred rather than predicting future moves.
Because RSI is a lagging indicator, the trader may receive confirmation of a signal after a large portion of the move has already been made. For this reason, many professional traders will not use the RSI indicator as a sole signal.
When RSI Fails in Strong Trend Cycles
RSI is of little use during strong bull and bear markets. In an uptrend, the RSI may remain overbought for a long period of time as prices continue to rise. The opposite is seen during panic-selling phases, where the RSI remains oversold as the price continues to drop.
This is why extremities should not be seen as definitive reversal points and why one should pay attention to wider momentum indicators when trading using the RSI in fast-moving markets like crypto.
FAQ
Can the RSI accurately predict reversals in cryptocurrency prices?
RSI can show weakening momentum, but it is not able to determine exactly when the momentum will reverse, and is usually used along with other indicators, such as price action, volume, and support/resistance.
What is the best timeframe to use RSI in crypto?
There is no best timeframe for every trader. Swing traders generally prefer to study a 4-hour or daily chart because it gives them more reliable signals than a low timeframe.
Why does the RSI take long periods to become overbought?
During strong bullish trends, buying pressure can remain dominant for extended periods. In these conditions, the market may continue rising even while RSI stays above traditional overbought levels.
Is RSI effective for people new to trading?
Although described as beginner-friendly due to its 0-100 scale and its arguably easy interpretation of momentum signals, RSI is best used as part of a trading strategy with risk management, rather than sole reliance.