Ethereum technical analysis is bullish but cautious as ETH▲$1,761.17 is testing crucial resistance after rebounding from the $1,700 level in July 2026. As of writing, ETH trades at $1,920 on a volume between $12 billion and $19 billion across crypto exchanges.

Contents
- Ethereum Price Today: Why ETH Is Testing a Critical Resistance Zone
- Ethereum Technical Analysis: Key Levels to Watch
- Ethereum Chart Analysis
- Ethereum Technical Indicators
- Is Ethereum Preparing for a Breakout?
- On-Chain Metrics Supporting the Technical Outlook
- Macro Factors That Could Move Ethereum
- Ethereum Price Prediction Based on Technical Analysis
- Trading Strategy for ETH
- FAQ
Ethereum Price Today: Why ETH Is Testing a Critical Resistance Zone
Current Price Action Overview
Ethereum rebounded from the crucial $1,700 level and is now testing the top of its July range. Buyers have propelled the price beyond the 20-day and 50-day exponential moving averages (EMAs). However, there are several robust resistance levels around $1,940–$2,000:
- The previous breakdown level
- The psychological level at $2,000
- The 100-day EMA at around $1,950–$1,970
- The supply zone from short sellers covering their positions
- Fibonacci retracement levels from the previous decline
Thus, the first critical level to overcome is $2,000. A break above it would enable bulls to target resistance at $2,100–$2,150, followed by $2,250–$2,300.
Read more: BitMine’s Tom Lee Explains Why ETH Price Is Falling — But Continues Buying Ethereum
What’s Driving Ethereum’s Recent Momentum
Ethereum has benefited from a risk-on environment as inflation concerns ease, Bitcoin rises, shorts cover their positions, and spot exchange-traded funds (ETFs) receive inflows.
Ethereum’s bullish scenario is also supported by reduced speculation, creating demand and enabling the price to rise without triggering extremely high funding rates.
Key Catalysts Traders Are Watching
The main catalysts driving Ethereum higher include:
- ETH’s close above $2,000
- BTC▲$62,630.00’s strength
- ETH spot ETF inflows
- Downward revisions to U.S. interest-rate expectations
- The Glamsterdam Ethereum upgrade
- The rise of stablecoins and decentralized finance
- Higher spot liquidity without extreme leverage
Ethereum Technical Analysis: Key Levels to Watch

| Level | Technical significance |
|---|---|
| $2,250–$2,300 | Medium-term resistance |
| $2,100–$2,150 | Breakout extension and supply |
| $1,940–$2,000 | Immediate resistance |
| $1,850–$1,880 | First support after a pullback |
| $1,780–$1,820 | Short-term support |
| $1,680–$1,720 | Medium-term support |
| $1,550–$1,600 | Bearish breakdown target |
Major Resistance Levels
Ethereum’s immediate resistance is around $1,940–$2,000. Bulls must conquer this level on high volume to trigger a breakout that sends the price toward $2,100–$2,150.
The next hurdle is $2,250–$2,300, which combines the previous supply zone and the descending trendline.
Strongest Support Zones
The first support level is around $1,850–$1,880: the lower edge of the short-term moving-average cloud.
The next critical level is $1,780–$1,820, where a bullish reversal candlestick would complete the higher-low structure.
The next support level is $1,680–$1,720. A breakdown below this level might send ETH price toward $1,550–$1,600.
Fibonacci Retracement Levels
Using the decline from the $2,300 high to the recent $1,550 low produces several crucial Fibonacci levels:
| Fibonacci level | ETH price target |
|---|---|
| 23.6% | $1,725 |
| 38.2% | $1,835 |
| 50% | $1,925 |
| 61.8% | $2,015 |
| 78.6% | $2,140 |
Ethereum is currently around the 50% level, explaining why the $1,900–$2,000 area is so significant. The next level to watch is the 61.8% retracement at $2,015.
Trendline Analysis
Ethereum has broken the descending trendline, which is a positive sign for bulls. The move above this level combined with higher volume creates favorable conditions for ETH to climb toward $2,000.
Read more: Arthur Hayes Buys $3.7 Million in Ethereum (ETH) After June Loss
However, the trend will change only when Ethereum makes a higher low above $1,800.
The most critical developments to watch include:
- ETH’s daily close above $2,000
- A successful test of the broken trendline
- The formation of a higher-low structure above $1,800
- Higher volume on the breakout day
Ethereum Chart Analysis
Daily Timeframe Outlook
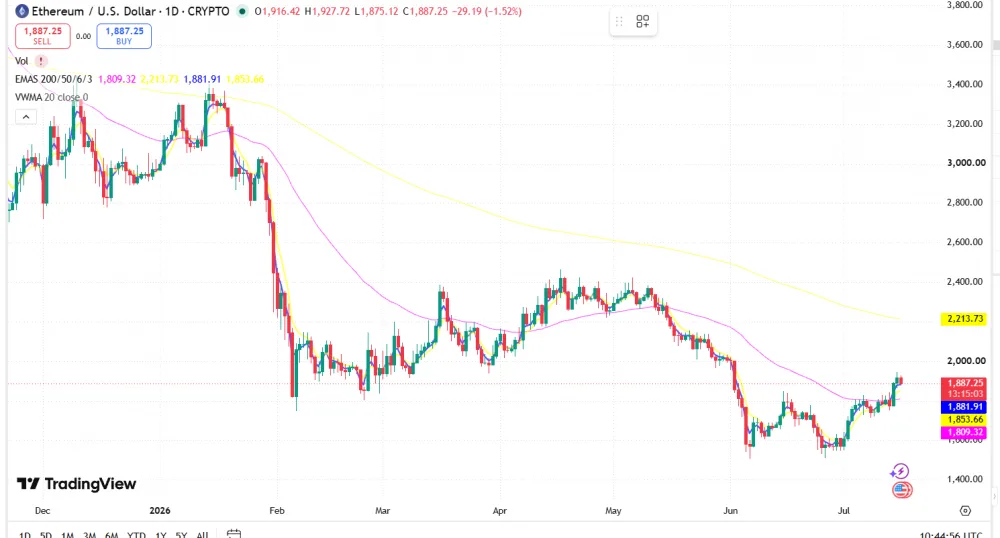
The daily chart shows improvement as the price makes higher lows and moves above crucial short-term moving averages.
Source: TradingView
Bulls have reclaimed the 20-day and 50-day EMAs but face resistance from the 100-day and 200-day EMAs. The next development to watch is Ethereum’s daily close above $1,950–$2,000.
A bearish scenario would see the price consolidating within the $1,800–$2,000 range instead of breaking above $2,000.
4-Hour Chart Structure
The four-hour chart displays higher highs and higher lows, signifying that bulls remain in control but are running out of momentum.
Traders should therefore prepare for a pullback or consolidation. Losing support at $1,850 would be bearish, while a breakdown below $1,800 would enable shorts to target $1,750.
Weekly Trend Analysis
The weekly chart remains neutral to bearish despite the recent move higher.
Bulls must overcome the long-term moving averages to confirm that a medium-term uptrend is forming. Bears will retain control over the broader structure until Ethereum registers a weekly close above $2,000 and subsequently $2,250.
Ethereum Technical Indicators
RSI Signals
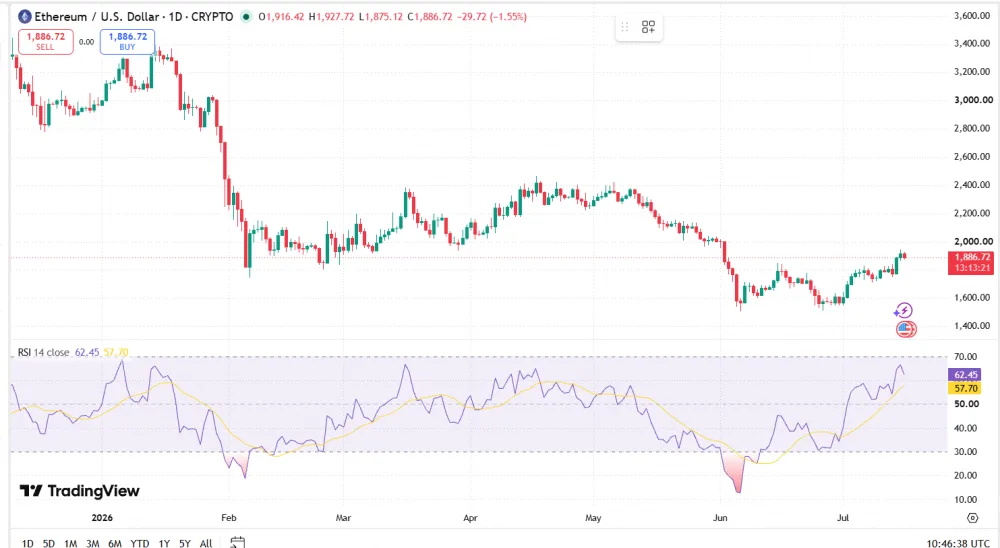
The daily relative strength index (RSI) for Ethereum is at 62, signaling bullish momentum without overbought conditions. The four-hour indicator is slightly lower at 57.
Source: TradingView
A price breakout combined with RSI above 70 would suggest that bulls have conquered critical resistance. A lower RSI high would create bearish divergence and place downward pressure on the price.
MACD Momentum
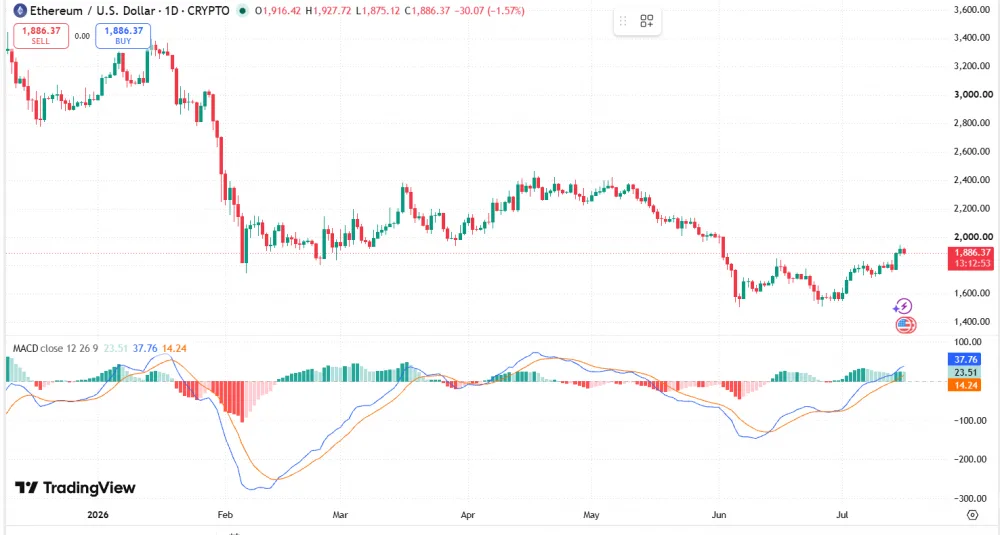
Ethereum’s moving average convergence divergence indicator is positive and has crossed above the signal line, registering a bullish crossover.
Source: TradingView
Momentum is improving as the histogram expands. Traders should watch whether the indicator remains in positive territory during the resistance test.
A bearish crossover below $2,000 would be the first indication of consolidation.
Moving Averages (20, 50, 100 & 200 EMA)
| Moving average | Approximate level | Daily significance |
|---|---|---|
| 20-day EMA | $1,720–$1,750 | Short-term support |
| 50-day EMA | $1,800–$1,880 | Reclaimed support |
| 100-day EMA | $1,950–$2,030 | Immediate resistance |
| 200-day EMA | $2,220–$2,530 | Long-term resistance |
The Ethereum technical analysis remains bullish but cautious while the price is below the 100-day and 200-day EMAs.
Bollinger Bands
Ethereum has climbed toward the upper Bollinger Band. It would be positive if the price consolidated above this level with high volume. Repeated rejections would send the price back toward the middle band.
Volume Profile and OBV
According to the volume profile, Ethereum’s major price-discovery area is between $1,750 and $1,900, and the price may consolidate around this range.
On-Balance Volume is improving, but bulls need a higher OBV reading to conquer $2,000. Failure to do so would enable bears to target $1,800.
Related: Why Is Ethereum Price Still Dropping? ETH Technical Analysis & Market Outlook
Is Ethereum Preparing for a Breakout?

Bullish Scenario
Bulls need ETH to close above $2,000 and successfully retest the level.
This would enable them to target:
- $2,100–$2,150
- $2,250–$2,300
- $2,400–$2,450
A close above $2,300 would confirm that ETH has entered a medium-term uptrend.
Bearish Scenario
The bearish scenario begins if Ethereum fails to hold above $1,940–$2,000.
This would enable bears to target $1,850 and then $1,800–$1,700. A close below $1,680 would indicate that bears have regained control.
Confirmation Levels for a Breakout
Several developments would confirm ETH’s bullish scenario:
- Daily close above $2,000
- Higher trading volume on the breakout day
- Successful retest of the $1,940–$2,000 resistance zone
- RSI remaining above 50
- Positive MACD signal
- BTC holding critical support
- Funding rates not spiking higher
Invalidating the Bullish Thesis
The bullish scenario would be invalidated if ETH failed to hold above $1,800 on the daily chart.
A close below $1,680 would be even more bearish, especially if exchange inflows spike, OBV decreases, and long liquidations accelerate.
On-Chain Metrics Supporting the Technical Outlook
Exchange Inflows and Outflows
Net withdrawals from exchanges favor bulls because they reduce the supply available for immediate sale.
Large inflows, on the other hand, may indicate that investors are preparing to sell. Bulls therefore need steady withdrawals or neutral flows while ETH tests resistance.
Whale Accumulation
Increases in large-wallet holdings can create favorable on-chain momentum if whales buy during consolidation.
Exchange, custodial, staking, and institutional wallets can all be regarded as whales. Consistent increases across multiple wallets are a more reliable bullish indicator than one large transaction.
Open Interest and Funding Rates
Ethereum derivatives open interest has grown steadily as traders speculate on bulls’ ability to conquer resistance.
Perpetual funding rates remain near zero or slightly negative, favoring longs without indicating extreme leverage.
Massive open-interest growth during consolidation or a bearish move could trigger profit-taking and liquidations.
Active Addresses and Network Activity
Most daily Ethereum transactions originate from transaction and settlement demand, while Layer 2 activity is also rising.
An increase in active addresses, stablecoin volume, fees, and decentralized exchange trading would improve the Ethereum technical analysis. Lower daily activity would undermine the bullish scenario.
Macro Factors That Could Move Ethereum
Bitcoin’s Influence on ETH
Bitcoin remains the critical external factor influencing Ethereum because BTC’s major support levels often dictate ETH price action.
A bullish Bitcoin scenario would enable ETH bulls to challenge $2,000, while a bearish move could send Ethereum toward $1,700.
ETF Flows and Institutional Demand
Inflows into spot ETFs have become a significant demand driver for Ethereum.
Institutional inflows favor bulls by absorbing selling pressure during the next move higher. Repeated ETF outflows would signify weak institutional demand and favor bears.
Federal Reserve Policy and Risk Assets
Federal Reserve policy can influence risk assets, including Ethereum.
Higher yields, rising inflation, and a hawkish Fed outlook would weigh on ETH. Lower yields, subdued inflation, and a dovish stance would benefit risk assets.
Ethereum Ecosystem Developments
Ethereum’s network developments support the longer-term bullish case.
The Glamsterdam upgrade and subsequent releases aim to make Ethereum more scalable and secure. Improvements to rollups, account abstraction, censorship resistance, and security may enhance adoption without immediately affecting the price.
Related: Top 5 Wild Ethereum Price Predictions for 2026: From Realistic to Moonshot Scenarios
Ethereum Price Prediction Based on Technical Analysis
Short-Term Outlook (Next 7 Days)
According to Ethereum technical analysis, ETH will likely consolidate within the $1,800–$2,050 range over the next week.
A close above $2,000 would enable bulls to push toward $2,050–$2,100. Bears will attempt to keep the price within the $1,800–$2,000 range if Ethereum fails to register a strong close above resistance.
Medium-Term Outlook (Next 1–3 Months)
Ethereum may enter a consolidation phase if it fails to overcome $2,000.
A close above this level would enable bulls to target $2,250–$2,450. A breakdown below $1,680 would shift the medium-term structure in favor of bears.
Key Price Targets if Resistance Breaks
| Bullish target | Details |
|---|---|
| $2,050–$2,100 | Extension of the breakout move |
| $2,250–$2,300 | Medium-term resistance |
| $2,400–$2,450 | Previous supply and long-term target |
| $2,600 | Extended bullish scenario |
Downside Targets if Support Fails
| Bearish target | Details |
|---|---|
| $1,850 | First support after a pullback |
| $1,780–$1,800 | Short-term structure support |
| $1,680–$1,720 | Medium-term support |
| $1,550–$1,600 | Breakdown target |
Trading Strategy for ETH
Breakout Trading Setup
A conservative breakout strategy would involve buying ETH after a four-hour or daily close above $2,000 combined with a bullish retest.
Traders could initially target $2,100 before eyeing $2,250. A stop-loss order below the breakout level can mitigate the risk of sudden rejection.
Pullback Entry Strategy
Traders using a pullback strategy should consider the $1,850 level as a potential entry after a bullish candlestick appears.
This strategy would target $1,940 with a stop-loss below $1,800.
A more conservative approach would involve waiting for Ethereum to enter the $1,780–$1,820 range before entering a long position after a bullish candlestick appears. This could allow traders to target $1,880 while setting a stop-loss below $1,750.
Risk Management and Stop-Loss Placement
Traders should risk only a small percentage of their capital on any trade.
Stop-loss orders should be set according to the trading strategy and market conditions rather than relying solely on the entry point.
Breakout traders may place stop-loss orders below reclaimed resistance. Pullback traders may set them below the relevant support level.
FAQ
Is Ethereum bullish right now?
Ethereum is bullish in the short term but remains neutral to bearish on higher timeframes. ETH needs to reclaim $2,000 to turn the medium-term structure bullish, while $2,250 is the key level for the long-term outlook.
What are Ethereum’s key support and resistance levels?
Ethereum’s immediate resistance is at $1,940–$2,000, followed by $2,100. Key support levels are $1,850, $1,800, and $1,700.
Is ETH about to break out?
Ethereum is testing a crucial breakout level, and bulls need to close above $2,000 to turn the near-term structure bullish. This would allow them to target $2,100–$2,250.
What does the RSI indicate for Ethereum?
The daily RSI is in the low-to-mid 60s and indicates bullish momentum without overbought conditions.
What is the next resistance level for ETH?
The next key resistance is $1,940–$2,000. A close above this area would enable bulls to target $2,100–$2,150.
Is now a good time to buy Ethereum based on technical analysis?
The chart is generally bullish, but Ethereum is testing crucial resistance. Waiting for a confirmed breakout or a pullback would provide clearer risk-management levels.
Which indicators are most reliable for analyzing ETH?
The most useful indicators include support and resistance, volume, moving averages, RSI, MACD, derivatives positioning, and Bitcoin’s price action.