Among the most widely followed Bitcoin on-chain indicators is the gap between market price and realized price. The realized price Bitcoin indicator is calculated using the value at which coins last moved on-chain and is commonly used to estimate aggregate cost basis.

Contents
- On-Chain Bitcoin Indicators Traders Rely on in 2026
- Technical Indicators Used for Bitcoin Market Timing
- Institutional Flow Indicators in 2026 Bitcoin Market
- Sentiment Indicators That Move Bitcoin Cycles
- Macro Indicators Affecting Bitcoin Timing in 2026
- Combined Indicator Models for Better Market Timing
- FAQ
On-Chain Bitcoin Indicators Traders Rely on in 2026
Realized Price vs Market Price (Detecting Overvaluation Zones)
Traders still use market price vs realized price to identify overly exuberant periods. Large deviations between market price and realized price have historically correlated with unrealized profits and distribution pressure, but institutional investment and the emergence of ETFs have shifted the patterns in a cycle.
MVRV Ratio Signals and What They Mean in 2026 Cycles
MVRV ratio Bitcoin traders monitor, remains one of the market’s most widely used valuation metrics. It compares Bitcoin market capitalization to realized capitalization, giving traders a rough idea of whether the current BTC▲$62,630.00 price is considerably higher than the average cost basis. Extremes have generally occurred during capitulation or overheated conditions.
In 2026, analysts combined MVRV with ETF flows, derivatives positioning, and liquidity. High MVRV still signals elevated unrealized profits, although institutional Bitcoin demand 2026 has helped sustain higher valuations than in previous cycles.
SOPR (Spent Output Profit Ratio) for Profit-Taking Pressure
For traders studying the SOPR Bitcoin meaning, the metric helps determine whether spent coins are being sold at a profit or a loss.
SOPR values above 1 generally indicate profit-taking from coins in circulation, whereas values below 1 indicate that traders are selling at a loss, or simply thrown into a defensive position.
Read Also: Bull-Bear Signal, Bitcoin ETF Inflows, Institutional Buys: What’s Driving BTC Price in May
In 2026, SOPR includes interest around macroeconomic news or ETF-induced spikes. Large Spent Output Profit Ratio spikes are still generally interpreted as profit-taking by a class of short-term holders following a large price increase. However, a reset of SOPR back to neutral levels is interpreted more often as a trend continuation, rather than weakness.
Exchange Inflow/Outflow Trends and Whale Behavior
Bitcoin exchange inflow-outflow activity remains one of the clearest markers of potential sell pressure or long-term accumulation behavior.
Analysts using whale activity Bitcoin tracker platforms keep monitoring large transfers for signs of near-term market pressure.
However, when spot demand is weakening or leverage is inflating, whale activity is not seen as an isolated incident anymore. Analysts now use exchange inflow and outflow trends along with wallet activity, liquidity, and derivatives data to assess changes in the market.
Technical Indicators Used for Bitcoin Market Timing
RSI Levels for Bitcoin in High Volatility Conditions
The RSI remains one of the best Bitcoin indicators for measuring momentum and liquidity in volatile cryptocurrency market conditions.
Many Bitcoin trading indicators 2026 traders rely on now require more flexible interpretation during prolonged high-liquidity rallies.
In volatile market conditions, traders might combine Bitcoin RSI with other technical indicators, such as volume and trend indicators, to make sure that false signals are avoided. A common Bitcoin RSI strategy during high-volatility bull markets is monitoring whether RSI holds above the neutral 50 level.
MACD Crossovers in Macro Bull and Bear Cycles
In macro Bitcoin cycles, the MACD indicator plays a prominent role in identifying momentum. Bullish Bitcoin MACD signals are frequently interpreted as confirmation of trend continuation during strong momentum phases.
Conversely, bearish MACD crosses often correspond with times when the market structure has started to weaken.
In 2026, stand-alone MACD crossovers are less important to traders and are studied alongside liquidity, ETF flows, and volatility. A weak/delayed MACD crossover is ignored in a bull trend unless there is a lack of participation in the market or a decrease in spot demand.
Moving Averages (50/200 EMA) as Trend Confirmation Tools
Bitcoin moving averages, 50, 200 EMA structures remain among the most commonly used tools for identifying overall market direction. An upward price movement, above both, is used to confirm a bullish signal.
Bitcoin price historically respects the 50 EMA as dynamic support during macro bull markets while retaining the 200 EMA as wider macro sentiment resistance during pullbacks. In 2026, price is focused on EMA alignment after macroeconomic news-induced volatility or institutional buying reactions.
Bollinger Bands and Volatility Expansion Phases
Perhaps the best tool to track these phases of volatility compression and expansion in the crypto space is Bollinger Bands. A common Bitcoin Bollinger Bands strategy entails monitoring squeeze formations before periods of major volatility expansion.
As of 2026, traders continue combining volume confirmation with other Bitcoin trend indicators to validate breakout conditions.
Long periods of consolidation with subsequent expansions tend to result in abrupt directional movement when derivatives activity is high and driven by macro liquidity expansions or contractions.
Institutional Flow Indicators in 2026 Bitcoin Market
Spot Bitcoin ETF Inflows and Their Market Impact
The rapid growth of US spot ETFs from that time onward has meant spot Bitcoin ETF inflows are now considered one of the best indicators of demand in the market and are grouped with exchange liquidity and on-chain supply in allocation data from BlackRock, Fidelity, and others.
Ongoing inflows have additionally reinforced what many analysts describe as Bitcoin accumulation zones 2026 investors continue observing closely.
As of 2026, ETF flow momentum is a short-term sentiment driver for traders, leading them to take defensive positions in environments defined by limited inflows or net outflows, combined with macroeconomic uncertainty and rising Treasury yields.
Futures Open Interest as a Leverage Sentiment Gauge
Bitcoin futures open interest analysis stays important for tracking leverage and speculative positioning during unstable market conditions. Open interest increases during rallies are seen as confirmations of bull activity, while extreme spikes during periods of volatility can indicate overcrowded positioning.
Traders in 2026 react to open interest using funding rates and spot market demand. Increased leverage sentiment, such as open interest without material buying, may be an indicator of an impending wave of liquidation-induced volatility.
CME Premium/Discount Signals for Institutional Demand
For traders evaluating CME Bitcoin premium meaning, elevated premiums frequently reflect stronger institutional demand for regulated futures exposure.
Read Also: Bitcoin Holds Above Key Levels as Analysts Confirm Bullish Momentum Remains Intact
In 2026, traders may give more weight to premium and discount signals during periods of high ETF activity or macroeconomic chaos, as sustained futures premiums may indicate solid institutional involvement and trading conditions.
Stablecoin Liquidity as a Proxy for Incoming Capital
Among the most important Bitcoin liquidity indicators are stablecoin supply growth and exchange reserve balances.
In 2026, analysts increasingly used trading pair stablecoins liquidity metrics to measure potential accumulation, along with exchange balance and ETF inflows. Many traders interpret rising exchange balances as a stablecoin inflow Bitcoin signal ahead of major volatility expansion phases.
Sentiment Indicators That Move Bitcoin Cycles
Fear & Greed Index Extremes and Reversal Zones
One of the most followed sentiment indicators for Bitcoin market is the Fear & Greed Index. The index seeks to determine if Bitcoin traders are in fear or are in excessive greed by looking at volatility, momentum, and social media activity.
Extreme fear readings have been correlated with capitulation periods, while extreme greed readings have been correlated with overheated markets.
Read more: What Is the Crypto Fear and Greed Index? Full Guide for Crypto Beginners
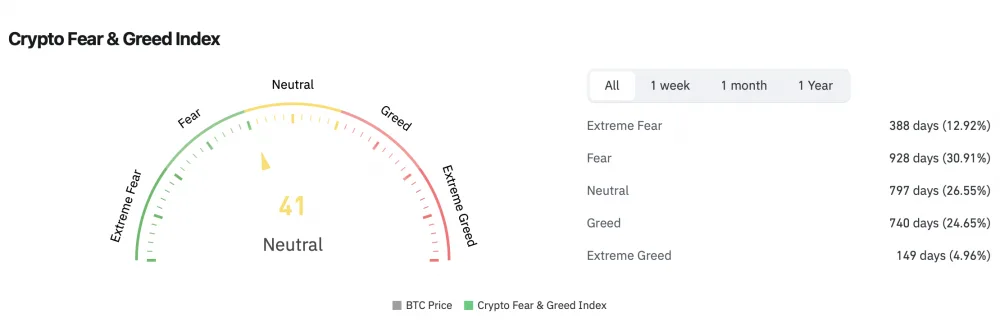
Although, as of 2026, reversal zones in the index are still used as contrarian indicators rather than triggers, and extreme investor greed can last a long time, they remain generally effective at forecasting spikes in volatility or periods of deleveraging following a period of worsening sentiment.
Social Media Activity Spikes and Retail FOMO Detection
A rise in the crypto economy on social media platforms such as X, Reddit, Telegram, and TikTok is progressively seen as the first signs of retail speculation. After spikes in hashtag activity, influencer engagement, and memecoin discussions, liquidity flows into Bitcoin and other cryptocurrencies typically follow.
In 2026, traders follow social media activity spikes that indicate the retail sector is accelerating, including retail FOMO detection, which coincides with breakout rallies when the price is outpacing underlying fundamental conditions in the market.
Google Trends Data for Bitcoin Demand Surges
However, search engine activity still acts as a useful proxy for mainstream interest, with spikes in Google Trends data for Bitcoin typically coinciding with increased retail awareness and activity in spot trading.
For 2026 searches, a spike in searches tends to correlate with big price breakouts or news about launching an ETF, especially if there are rising volumes in the spot market and boosting liquidity.
Funding Rates and Overheated Derivatives Markets
Funding rates on perpetual futures contracts remain the clearest indicator of excessive speculation in crypto derivatives. When funding rates are positive, longs pay shorts; when they are deeply negative, the prevailing sentiment is short. Prolonged extremes in either direction are often followed by volatility and liquidation events.
As of 2026, analysts track funding rates to identify points of overcrowded positions in a market that are showing aggressive moves. High positive funding across exchanges indicates overheated derivatives markets and the use of overextended leverage compared to spot demand.
Macro Indicators Affecting Bitcoin Timing in 2026
US Interest Rates and Liquidity Cycles Impact on BTC
The most important Bitcoin indicators 2026 traders monitor on the macro side remain Fed policy, cash flow conditions, and interest rates, as tight lending environments continue pressuring speculative assets. In addition to ETF flows, analysts track Fed rhetoric, Treasury yields, and liquidity status.
Bitcoin’s sensitivity to US interest rates has shifted from changes in interest rates to changes in liquidity, notably regarding financial tightening or balance-sheet normalization, and as the risk appetite in equity markets and high-growth stocks decreases, Bitcoin volatility increases dramatically.
Dollar Index (DXY) Correlation With Bitcoin Moves
The inverse correlation with the USD Index is an important macro signal for traders, as an appreciating dollar signals tightening global liquidity and risk-off positioning, both of which are generally negative for crypto markets.
In 2026, DXY correlations will still be watched, including around periods of increased macro volatility or Fed expectations. During periods of DXY rallying, the momentum of Bitcoin weakens, and speculation decreases.
Inflation Data and Risk Asset Rotation Patterns
Inflation releases remain the primary source of Bitcoin volatility and other digital assets. The CPI and PCE figures, when above (or below) forecaster expectations, typically indicate expectations for a more (or less) hawkish monetary policy stance.
Read Also: Bitcoin Treasury Capital B Raises $17.8M Toward 1% BTC Supply Goal
By 2026, analysts looked at inflation data in the context of capital allocation. They observed that a decrease in inflation has often been coupled with rotation into crypto, equities, and tech sectors in favorable liquid market conditions.
Global Liquidity Expansion vs Contraction Cycles
Macroeconomic factors, particularly liquidity, remain important for the long-term BTC price movement. Among the most important crypto market indicators Bitcoin traders follow are central bank liquidity status and money supply growth.
Periods of liquidity contraction tend to increase volatility and reduce speculation. In 2026, market participants focus mainly on repo markets and central bank balance sheet policies to determine whether global liquidity expansion or tightening conditions will dominate and determine Bitcoin price.
Combined Indicator Models for Better Market Timing
| Indicator | What It Tracks | Bullish Signal | Bearish Signal |
| MVRV Ratio | Unrealized profit levels | Moderate growth | Extreme overheating |
| SOPR | Profit-taking activity | Reset above 1 | Persistent selling below 1 |
| RSI | Momentum strength | RSI above 50 | RSI below 30 |
| ETF Inflows | Institutional demand | Sustained inflows | Net outflows |
| Funding Rates | Derivatives positioning | Neutral-positive rates | Overcrowded longs |
| Exchange Flows | BTC movement to exchanges | Exchange outflows | Heavy inflows |
On-Chain + Technical Signal Confluence Strategy
Professional traders more and more depend on Bitcoin analysis tools 2026 strategies combine with blockchain analytics and chart-based models. In this way, on-chain pricing methods can be used to identify better levels of support and resistance, as well as more reliable momentum zones in volatile price moves, instead of relying on one or the other.
A common On-Chain + Technical Signal Confluence Strategy could include using the MVRV or SOPR in combination with RSI structure, moving averages, and spot volume confirmation. Such setups can be the strongest when technical momentum coincides with improved network activity and sustained inflows.
Risk-On vs Risk-Off Regime Detection Framework
As Bitcoin has become more integrated with customary finance, the macro regime has become important, and traders analyze Treasury yields, liquidity, and strength of the dollar, in addition to crypto metrics, to assess whether the market is in a risk-on or risk-off regime.
By 2026, the Risk-On vs Risk-Off Regime Detection Framework will be commonly used when adjusting crypto risk exposure according to macro uncertainty. In risk-off phases (which correspond to less liquidity and tighter financial conditions), speculative assets are expected to face more pressure, while monetary easing generally raises crypto sentiment.
Multi-Timeframe Analysis for Entry and Exit Timing
Professional market participants increasingly use Multi-Timeframe Analysis as element of broader strategies focused on how to time Bitcoin market cycles more effectively.
Higher timeframes are typically used to establish the direction of the underlying trend, while lower timeframe charts are used for entry and exit timing.
For 2026, combining daily, weekly, and intraday momentum signals is still a common entry and exit timing method, where an analyst looks for higher timeframe trend strength and confirmation of higher volume before adding exposure on breakouts, which reflects bullish breakout conditions with added confirmation.
Common False Signals and How to Avoid Them
False breakouts and fake momentum changes have historically been a chronic issue in crypto trading, especially during low liquidity windows and periods of high leverage in the market.
This is a recurring theme by Glassnode analysts who warn that isolated metrics can quickly deteriorate when volatility expands or macro shifts abruptly.
Traders are increasingly looking to verify in several datasets in order to prevent falling victim to these common false signals; relying on just one is no longer sufficient.
Combining on-chain activity, liquidity trends, derivatives positioning, and technical structure has become one of the most effective ways to avoid emotions in the current Bitcoin trading environment.
FAQ
Which indicators are considered the most reliable for Bitcoin market timing?
No single tool consistently predicts market direction, which is why Bitcoin market timing indicators are usually combined across on-chain, technical, and macroeconomic analysis.
What causes Bitcoin indicators to give false signals?
Crypto markets are still highly sensitive to liquidity, macroeconomic shifts, and levered positions, which means that sudden volatility can invalidate setups under certain circumstances.
Are on-chain indicators a better alternative to technical indicators?
They are therefore used differently, with on-chain data being used to analyze investor actions and the health of a network, while technical indicators are more often used for short-term momentum trading.
How influential are ETF flows on Bitcoin price movement in 2026?
Spot ETF trading has become a major factor for institutional demand: strong inflows have driven bullish trends, while low demand has dampened sentiment and drained liquidity.
Will Bitcoin’s price remain influenced by macroeconomic data?
Yes. Bitcoin is sensitive to interest rates, inflation expectations, dollar strength, and liquidity factors, particularly as institutional investors have increasingly joined the market.