Bitcoin might touch $100K by the end of 2026 – then again it could fall hard. One path points up if investors keep buying in waves. Another sees a slump should regulations tighten fast. Then there’s wild swings driven by surprise tech shifts. Each turn depends on different triggers nobody fully controls.
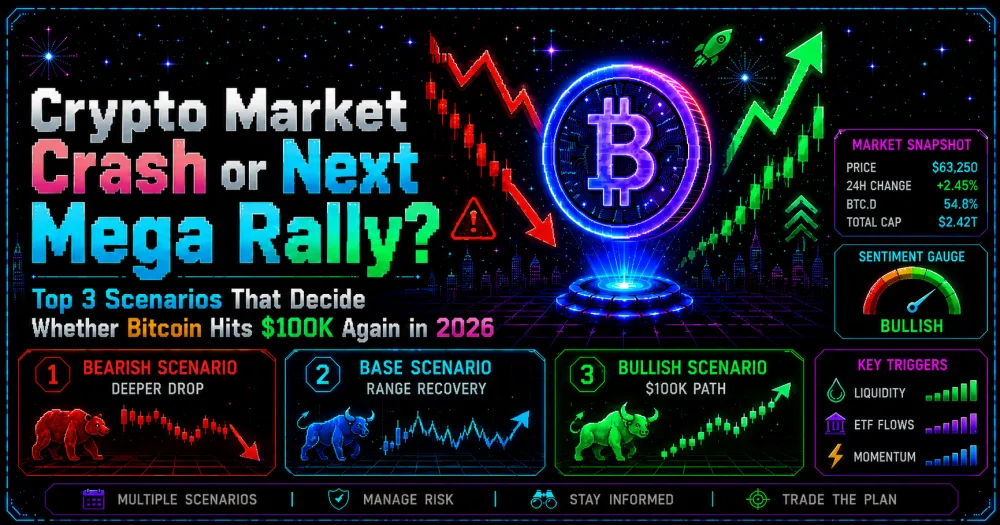
Mid-2026 finds digital currency caught in a tug of war. A downturn might signal something heavier unfolding. Or it could be Bitcoin shaking off excess risk ahead of another surge. Three roads now stand open – explosive growth, sideways drift, or sinking back into cold territory.
This time around, the 2026 conversation isn’t just about optimism versus fear. Even if Bitcoin drops sharply, it might still be part of a broader upward phase. A quick rebound could happen even when underlying strength fades slowly. Instead of reacting to single news events, pay attention to the order they happen in – watch liquidity build up first, then track where ETF money moves next, after that examine shifts in leverage, and finally check long-term holder behavior for confirmation.
Should all four move up at once, the outlook for Bitcoin’s price in 2026 shifts noticeably. Yet when they pull apart, choppy conditions might linger despite sharp rebounds. Still, alignment matters most behind the scenes.
Contents
- 1.Crypto Market Crash Or Early Deleveraging Phase? What Is Really Happening
- 2.Why Bitcoin Lost Momentum After Hitting Key Psychological Levels
- 3.Scenario 1 — Liquidity-Driven Mega Rally Toward $100K+ Bitcoin
- 4.Scenario 2 — Extended Consolidation Between $50K–$80K Range
- 5.Scenario 3 — Deeper Correction And Structural Bear Market Risk
- 6.What Determines Which Scenario Wins? Core Market Drivers
- 7.Bitcoin $100K Narrative: What Has To Align For Rebound
- 8.Historical Cycle Mapping: Where 2026 Fits In Bitcoin’s Multi-Year Structure
- 9.Key Market Signals Traders Are Watching Right Now
- 10.Institutional Positioning And Its Impact On Bitcoin Price Direction
- 11.FAQ
Crypto Market Crash Or Early Deleveraging Phase? What Is Really Happening
Market Structure Shift After Bitcoin ETF Adoption And Institutional Inflows
After ETFs arrived, Bitcoin moves shifted. Now it dances with miners’ choices, big holders shifting positions, small buyers jumping in, money moving through funds, investors adjusting holdings, on top of guardrails set by large financial players.
Is This A Crash Or Controlled Deleveraging Of Overextended Positions?
Confidence shatters when markets fall apart. Crowded bets vanish as investors pull back. By mid-2026, Bitcoin could just be correcting instead of collapsing completely.
Role Of Liquidity Tightening And Global Risk-Off Sentiment In Crypto Decline
Here’s where it gets shaky – cash flow dries up when interest stays steep. Risky bets get dumped early if markets turn cautious, especially digital coins. That jolt hits hardest once speculators pull out fast.
Comparison With Previous Cycle Corrections (2018, 2022, Post-Halving Pullbacks)
Back then, things dropped just like they did now. When prices fell in 2018, regular buyers pulled back. By 2022, it wasn’t shoppers – it was borrowed money causing trouble. After each halving, dips appeared first – then, upward movement resumed.
Why Bitcoin Lost Momentum After Hitting Key Psychological Levels
Breakdown Of Major Support Zones And Liquidity Clusters
After key support levels turned visible to everyone, Bitcoin slowed down. When too many watch the same spot, its break sends shockwaves through open positions. The price drops deepen fast when forced exits pile up below that point. What follows often ignores actual value for a while. The momentum fades just as traders rush for the exit together.
ETF Inflows Slowdown Vs Profit-Taking From Early Institutional Buyers
Bitcoin ETFs can lift prices when money pours in. When interest fades, that cushion evaporates, too. Upswing comes from fresh cash rushing in. Without steady buying, pullbacks find less resistance. Momentum builds one way, then weakens the other.
Derivatives Market Overheating — Funding Rates And Liquidation Cascades
A sudden slip might come not from weak hands but from cooked hedges. Price dips squeeze overstretched bets when the cost to hold them burns too hard.
Whale Distribution Patterns And On-Chain Exchange Inflows
When whales shift coins, it often hints at coming sell pressure. Inflows into exchanges tend to mean trouble ahead. Activity away from trading platforms feels less threatening. More holdings moving in raise chances of a drop.
Related: Top 5 Altcoins for the Next 100x Crypto – Best Crypto to Buy Now 2026
Scenario 1 — Liquidity-Driven Mega Rally Toward $100K+ Bitcoin
What Conditions Are Needed For Liquidity Expansion To Return
A surge in Bitcoin hinges on smoother access to cash, growing ETF investments, more stablecoins circulating, while futures activity settles down. Fresh money absent, stories lose traction. Hype fades when wallets stay shut.
Impact Of Interest Rate Cuts On Risk Assets And Crypto Inflows
When rates drop, money moves away from savings. Lower returns on deposits push investors toward alternatives. A softer stance from central banks might revive interest in digital coins. Money could flow back into exchange-traded funds. Stock-like tokens may see activity pick up again. Physical market trading often follows such shifts.
Institutional Accumulation Phase And ETF-Driven Demand Shock
When groups gather more Bitcoin, pressure builds. New coins crawl into existence at a fixed pace. Should exchange-traded funds join hands with government vaults, scarcity might ignite fast movement. A climb toward one hundred thousand dollars could unfold before an eye’s blink.
Fear tends to spark Bitcoin’s biggest surges, and it never eases. By 2026, though, fresh momentum will hinge on appetite for ETFs.
Scenario 2 — Extended Consolidation Between $50K–$80K Range
Why Sideways Accumulation Phases Dominate Post-Halving Cycles
Later on, sideways movement could just be the sensible compromise. After halving events, prices usually wait – settling swings until direction returns.
Market Absorption Of Early ETF Buyers And Redistribution Phases
Some people who buy ETFs do not keep them forever. When ownership shifts, more determined investors take over the available shares before any big move happens.
Volatility Compression And Declining Retail Participation
Here’s something odd: calm stretches seem dull, yet they quietly reshape things. When prices stop jumping around, the chaos fades. Fewer people get pushed out of positions. That stillness? It lays down firmer ground.
How Long Consolidation Phases Typically Last In Bitcoin Cycles
Months might pass during consolidation. Watch closely – does every drop end at a higher point than before? A new floor forming means strength hiding beneath.
Scenario 3 — Deeper Correction And Structural Bear Market Risk
Breakdown Of Key Macro Triggers That Could Extend Downside Pressure
If inflation refuses to drop, the outlook turns heavier. Rate reductions slipping pushes that mood further. A firmer dollar adds pressure, too. Weak stock markets pour cold water on hopes.
Risk Of Sustained ETF Outflows And Institutional De-Risking
Outflows that keep going might signal trouble most clearly. When markets get shaky, big investors often pull back a bit – especially those with deep pockets.
Liquidity Contraction And Impact On Altcoin Market Structure
When liquidity shrinks, altcoins feel pressure before Bitcoin does. A drop in stablecoin availability strips support from minor tokens while raising chances of a downturn across crypto.
Historical Analogues: 2018-Style Multi-Quarter Drawdowns Vs 2022 Capitulation
A slow bleed downward defines the 2018 route. The 2022 version? A sharp collapse without warning. Either way, markets drain of liquidity first.
Here’s what matters most: each situation could shift at any moment. A swift turn from red to green might happen once cash flows return and panic trades slow down. Still, gains may stall should prices climb only because of borrowed money rather than actual buying interest.
What Determines Which Scenario Wins? Core Market Drivers
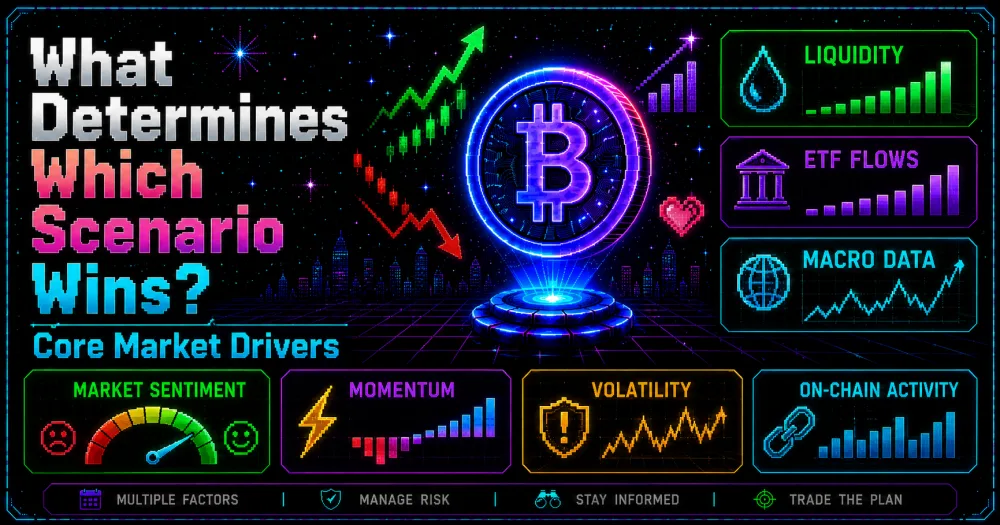
Global Liquidity Cycle (M2 Growth, Central Bank Stance, Dollar Strength)
Bitcoin moves mostly because of how much cash flows around it. When big banks ease up, that helps prices climb back. A falling dollar also gives things a boost. Without enough money moving freely, gains tend to fade fast.
Bitcoin ETF Flows As Primary Demand Indicator
These days, ETF money movements feel like a live pulse check on appetite. When cash keeps streaming in, it props up the argument for a rising market. On those stretches when funds keep draining out, that feeds the narrative of a sinking one.
Derivatives Positioning (OI, Funding Rates, Liquidation Heatmaps)
When open interest (OI) climbs, plus funding turns steep, it hints at overcrowded trades. A lasting move up in Bitcoin often happens only after big leveraged bets fade out. Heatmaps lighting up signal where pain might hit fast.
Related: Best Bitcoin Rewards Cards: Top 5 Compared
On-Chain Behavior Of Long-Term Holders Vs Short-Term Speculators
When long-term holders stand their ground, dips turn into chances to buy more. Should those investors keep holding, hopes for a Bitcoin rebound by late 2026 stay real.
Bitcoin’s 2026 value? Not one trigger, but layers of them. ETF interest might lift prices – only if cash flows freely elsewhere. Fewer coins available after the recent halving could matter – if someone buys them. Hope may return – but only once key lows show they’re firm.
Bitcoin $100K Narrative: What Has To Align For Rebound
Demand-Supply Imbalance After Halving And Miner Economics
Supply slowed when the halving hit. Yet smaller coin releases alone change little. For true imbalance, the number of buyers must surge, too.
Institutional Adoption Curve And Allocation Thresholds
Bitcoin finding its way into big funds doesn’t depend on everyone jumping in. Even tiny slices of investment carry weight – since there’s only so much available to trade. What moves markets isn’t universal participation, but how tightly held the asset already is.
Retail Participation Return And Sentiment Cycle Recovery
Only once the rebound has started does retail show up. When people start searching more, trading picks up, while hopeful talk spreads online; that is when mood shifts toward risk again.
Macro “Risk-On” Environment Alignment Across Equities And Crypto
When stocks start chasing returns, Bitcoin often follows hard. Should fear return to Wall Street, gains could stall fast.
Historical Cycle Mapping: Where 2026 Fits In Bitcoin’s Multi-Year Structure
Post-Halving Lag Effect And Delayed Upside Phases
Months go by before Bitcoin climbs again following the halving. That stretch lets traders adjust to fewer coins while interest slowly returns.
Comparison With Previous Cycle Timing And Peak Formation Patterns
Last time highs happened because money flooded in, shoppers came back, then trust spread wide. This round might get a boost from ETFs pulling interest early or stretching things longer.
Role Of Macro Liquidity In Extending Or Compressing Cycles
Certain forces stretch economic phases when money flows freely. When funds shrink fast, the timeline shortens just as quickly. Numbers on a screen miss what drives 2026’s path. Patterns drawn in hindsight reveal only part of the story.
Structural Differences Between Pre-ETF And Post-ETF Markets
Bitcoin now reacts faster to money movements because it’s tied tighter to regular markets after the ETFs arrived. Connections grow stronger, so big economic shifts hit harder.
Key Market Signals Traders Are Watching Right Now
Bitcoin Dominance Trend And Capital Rotation Into Altcoins
When Bitcoin’s share rises, money often stays put in BTC instead of moving elsewhere. A strong start to upward trends tends to center on Bitcoin first.
Stablecoin Supply Expansion Or Contraction As Liquidity Proxy
When stablecoins grow, cash moves into markets. Shrinking supply shows traders stepping back. More tokens often signal readiness to buy. Less means hesitation spreads quietly.
Exchange Reserves And Long-Term Holder Conviction Metrics
Falling exchange reserves often mean owners are holding instead of selling. When reserves climb, it might show people rushing to offload. True belief in value reveals itself when others fear – accumulation happens quietly then. Conviction stands clear apart from market noise.
Related: Binance Faces EU Exit: World’s Largest Crypto Exchange Misses MiCA License
Volatility Index And Trend Strength Indicators (RSI, MVRV, SOPR)
What happens when prices stretch too far? RSI hints at tension in trader behavior. Meanwhile, MVRV compares the current price to the average cost of coins. That contrast can signal if assets are sitting above or below break-even. Then there is SOPR – tracking actual gains or losses on spent coins. Put these pieces close together, and a picture forms. Not excitement. Not fear. Just data pointing to imbalance – or cleanup.
Institutional Positioning And Its Impact On Bitcoin Price Direction
ETF Inflow/Outflow Sensitivity To Macro News Cycles
After inflation numbers drop, ETF movements might shift. Central bank words often shake things up, too. When stocks tumble, expect adjustments in flow patterns. Lately, Bitcoin has been reacting much as older financial markets do. Timing now matters more than before.
Hedge Fund Positioning And Risk Parity Adjustments
Some hedge funds keep actual Bitcoin, yet protect themselves using futures or options. When they sell, it might be about managing risk – belief could still be strong.
Corporate Treasury Adoption Trends And Bitcoin Balance Sheet Exposure
Long-term support still comes from corporate treasuries holding Bitcoin. Confidence grows when firms keep it or buy more – though selling tends to shake trust. Sentiment shifts follow their moves, slowly but surely.
Impact Of Regulatory Clarity On Institutional Participation
What if rules were easier to follow? That might bring more institutions on board, simply because holding assets would feel less risky. When guidelines tighten up, confusion around oversight tends to fade. Markets still jump around no matter what laws exist. Yet a clearer path through legal requirements could let new players join without such heavy upfront hurdles.
FAQ
Bitcoin Reaching $100K by late 2026?
One way Bitcoin might touch $100K by late 2026 is through better market liquidity. Should exchange-traded funds start pulling in cash once more, that could help push things forward. Another piece? Leverage across trading platforms settling into a calmer state. When long-term owners hold firm, fewer coins are in circulation. That squeeze on available supply may matter just as much.
Bitcoin Bull Market Status Uncertain?
Bullish momentum lingers for Bitcoin so long as key levels on longer charts stay intact, while buying interest reappears. Without follow-through rallies, that idea crumbles – each weaker peak chips away at the case.
Did Bitcoin Slow After the ETF Approval?
Fresh money trickled away just as excitement faded. Profits started getting grabbed fast once gains piled up. Markets got stretched thin from too much borrowed cash. Worries about the big picture crept back right when confidence wavered.
What Are Bitcoin Price Factors in 2026?
In 2026, Bitcoin’s value shifts with how much money moves through ETFs. Liquidity across major economies plays a role, too. Leverage used in derivative markets adds pressure one way or another. Long-term holders deciding to keep or sell changes the balance. The amount of stablecoins circulating tweaks short-term dynamics. Big financial players stepping in influence direction over time.
Is This a Crypto Market Crash or Recovery?
A sudden drop could spark chaos just as easily as calm builds through steady movement. Success rides not on hope but on where money moves, how much risk sits in the system, who holds tight, and whether cash stays available.
Bitcoin Recovery Scenarios 2026?
Beyond the peak near six figures, Bitcoin might hold steady between fifty grand and eighty. Another path could see it pull back further than expected. Above one hundred thousand dollars stands as one possible high point next year.
What Could Signal a Major Bitcoin Rise?
Bitcoin jumping big means ETF money must grow, while stablecoins stretch further across markets. Softer economic pressures help, too, yet that alone won’t push prices without calmer futures trading. Rising trust among smaller buyers matters just as much, even if flows tick upward slowly. Confidence builds when positions stop bleeding fast, especially after wild swings scare most off. Markets tend to lift only once fear fades quietly behind steady activity.