Bitcoin bear market losses may be close to a bottoming phase, but analysts warn that crypto still faces pressure from weak on-chain activity.
Bitcoin is flashing signals that have appeared near earlier cycle lows, but this time the pressure is coming from more than price weakness.
Jamie Coutts, chief crypto analyst at Real Vision, a financial research firm, said in an X post his earlier call for Bitcoin price to bottom in Q2/Q3 based on historical bear-market structures is “playing out,” adding that the setup is “approaching very attractive levels” and that BTC▲$62,630.00 is in the “long-term accumulation zone.”
The only problem, according to Coutts, is liquidity. He said retail and institutional flows have been rotating out of Bitcoin and crypto since Q4 2025, while marginal liquidity has gone into AI. He explained:
“Right now, the capital allocation argument sits with AI equities and commodities. On-chain activity is back at multi-year lows.”
Coutts also pointed to 2027, when the U.S. faces over $3.6 trillion in coupon maturities, 36% above the 2020-2025 average, describing that as Covid-era debt being repriced from near-zero rates to 4-5% levels.
Read also: Bitcoin Treasuries Face $62B Wipeout as BTC Falls Near $62K
He warned that rolling those maturities through a contracting Federal Reserve balance sheet without stress in the bond market would require unusually strong fiscal and monetary management.
“I don’t see how they do it without far more Fed-side liquidity,” Coutts said. “Bitcoin will detect it first. But there’s still an uncomfortable distance to travel.”
Other market indicators
Frank Fetter, an analyst at Glassnode, a blockchain analytics firm, said Bitcoin’s monthly RSI, a momentum indicator traders use to track whether an asset looks overbought or oversold, has dropped to its second-lowest level on record.
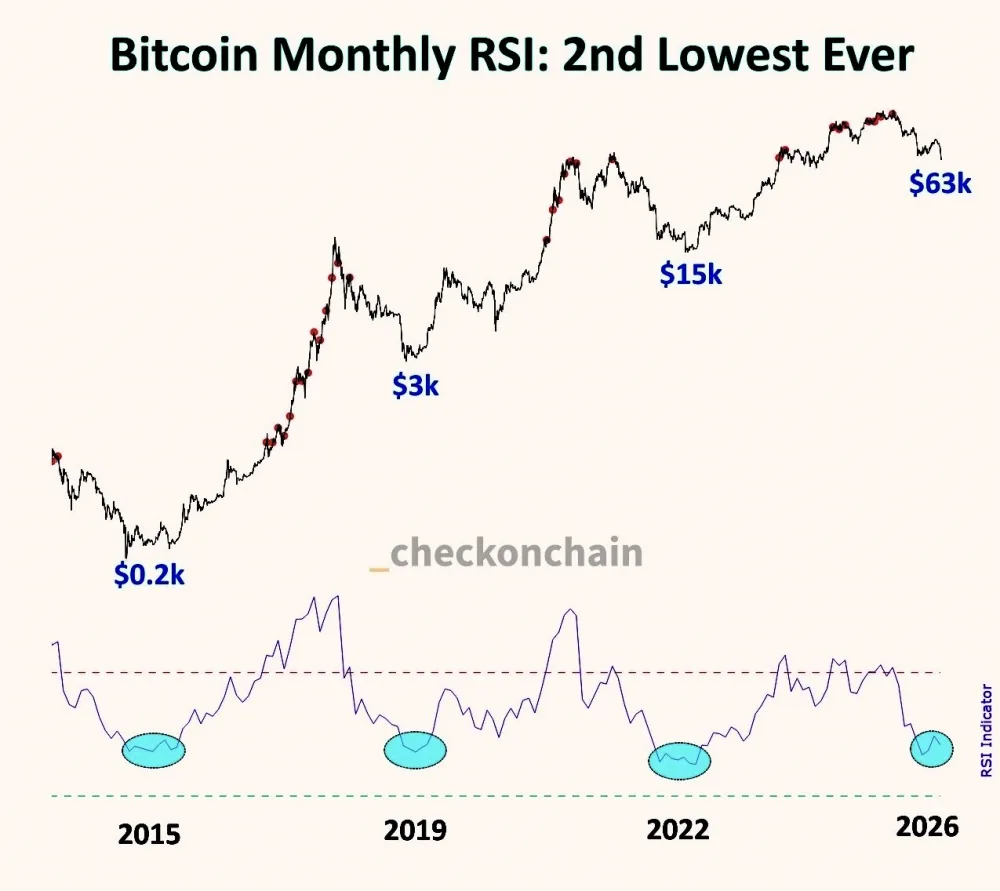
The chart he shared showed similar low-momentum zones around 2015, 2019 and 2022, which were followed by later Bitcoin price recoveries.
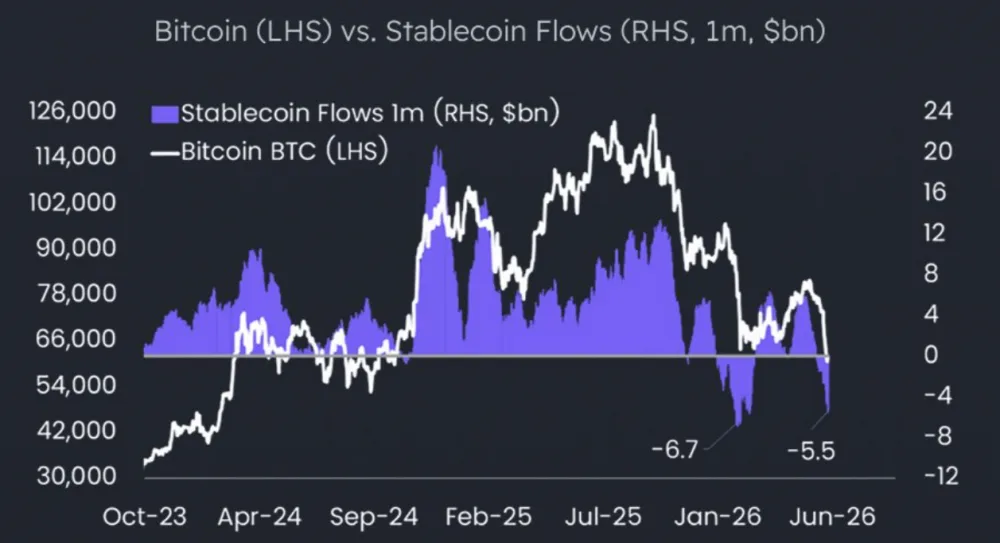
BIT, a crypto financial services firm formerly known as Matrixport, pointed out in an X post that stablecoin outflows are creating another headwind for Bitcoin, saying the market is dealing with a second wave of roughly $5 billion to $6 billion in 30-day stablecoin outflows.
The firm said the one-month change in stablecoin supply had stayed positive through much of the bull market, but flows have now weakened again. That points to less supportive liquidity for crypto and stablecoin issuers until inflows recover.
Read more: Bitcoin Price Drop Brings Record Holder Losses in BTC History