When a user decides to check a particular crypto asset’s page, they are often presented with information regarding that asset’s market capitalization and volume. In most cases, these two pieces of information are displayed side by side and are considered one entity. However, in reality, these are two different pieces of information that can be used to assess a crypto asset.
To understand this concept better, a comparison can be made between these information:
| Metric | Sample value | Main question | What it does not prove |
|---|---|---|---|
| Market cap | $2.4B | How large is the asset now | Easy entry and exit |
| 24h volume | $180M | How active is trading today | Project quality or safety |
Contents
- What is Volume and Market Cap in Crypto
- Market Cap and Volume: What Is the Difference and Why You Should Not Mix Them Up
- How Does Market Cap Affect Crypto Price
- Volume to Market Cap Ratio: How to Read the Relationship
- Liquidity vs Market Cap: Why Size Doesn’t Reflect Tradability
- Volume vs Market Cap in Coin Analysis Before Entry
- Common Mistakes When Comparing Market Cap and Volume
- Final Take: How to Use Both Metrics Together
- FAQ
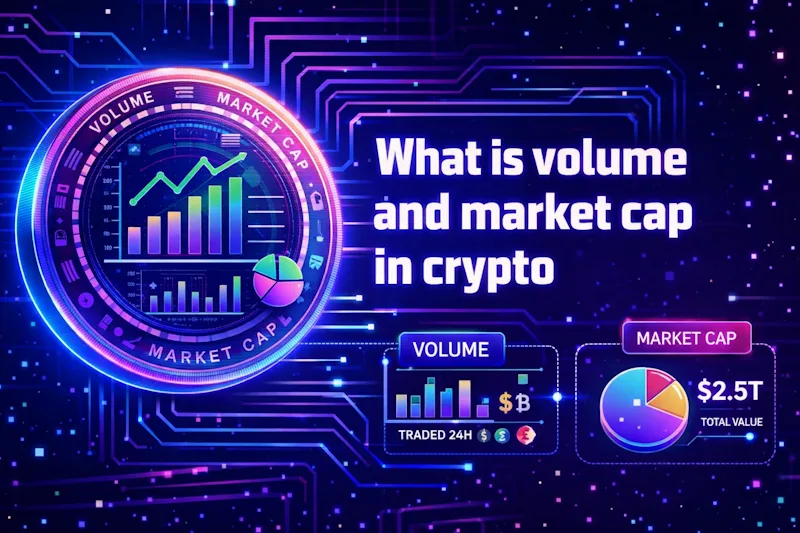
What is Volume and Market Cap in Crypto
Volume is a total sum of value traded over a selected time frame. In most cases, this time frame is 24 hours. Market capitalization is a product of price and circulating supply. However, these two pieces of information are not sufficient to confirm that a crypto asset is considered safe and profitable.
One more thing to note: even small trades can shift the last price, and the market cap of all the circulating coins is instantly recalculated.
Market Cap and Volume: What Is the Difference and Why You Should Not Mix Them Up
One of the most common mistakes is the tendency to mix up market cap and volume. While market cap is the measure of size, volume is the measure of activity. When comparing the two, the focus should be on the current activity in comparison with the size rather than the potential future activity.
While market cap represents the current value of the coin, volume represents the number of active participants in the market. In some cases, market cap and volume may grow in tandem, but in other cases, they may behave differently. This may be a bad sign.
Examples:
– High market cap and low volume: A large project with low interest.
– Mid market cap and high volume: A mid-tier project with high interest.
– High price and low volume: A possible lack of confirmation in the market.
| Case | Market cap | 24h volume | Turnover | Basic read |
| Large coin, quiet tape | $12B | $90M | 0.75% | Big asset, weak current participation |
| Mid-cap, active tape | $1.5B | $180M | 12.0% | Strong repricing and attention |
| Price jump, flat flow | $800M | $20M | 2.5% | Move may lack broad confirmation |
These are the basic patterns that can be observed in the market. They are not the final conclusions.
How Does Market Cap Affect Crypto Price
Market cap is the result of the price rather than the reason behind the price. If the price goes up by 10%, the market cap goes up by the same value.
As Aswath Damodaran, Professor of Finance at NYU Stern, argues, markets are pricing mechanisms before they are value mechanisms. That is why market cap is a price-based snapshot, not proof of intrinsic value or a guaranteed move.
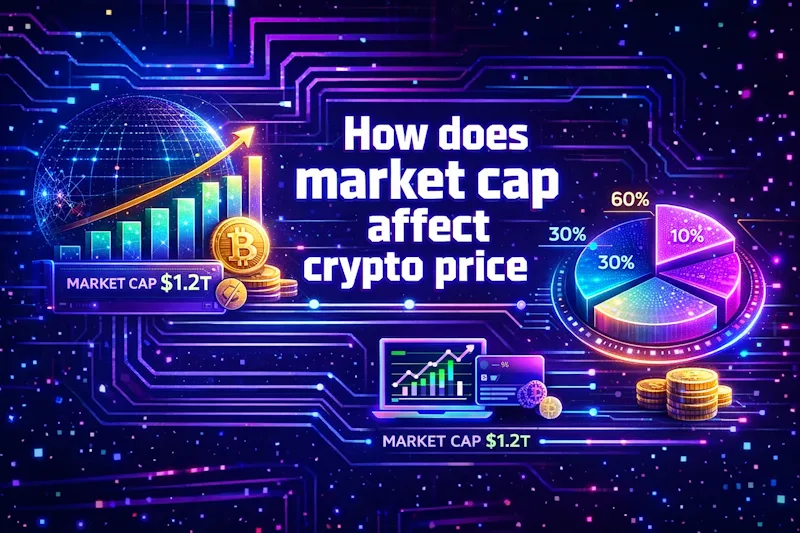
While large market cap coins require more capital inflow in order to sustain the price movements, small market cap coins are more volatile and can fluctuate more. Having a low price does not necessarily mean the coin is undervalued because the size of the supply is also an essential factor.
Market capitalization can best be viewed as a snapshot based on price rather than any kind of intrinsic value.
Volume to Market Cap Ratio: How to Read the Relationship
The volume to market cap ratio can be used to compare different volumes across different-sized assets. The higher the ratio, the more interest or higher trading volume there might be in the asset, whereas a low ratio might indicate less interest or trading volume.
The volume to market cap ratio needs to be viewed over a range of days rather than just a singular day, taking into account other relevant factors like spreads, exchange quality, and price. The volume figure might not be accurate due to false reporting or excessive volume on poor exchanges.
| Ratio | Volume on a $1B cap | What it may suggest |
| 0.5% | $5M | Low turnover, check spread and venue concentration |
| 3% | $30M | Normal interest, continue with liquidity checks |
| 12% | $120M | Active repricing, confirm exchange quality |
| 40% | $400M | Very hot market, check sustainability and fake flow risk |
This ratio should be viewed in terms of trends rather than singular values.
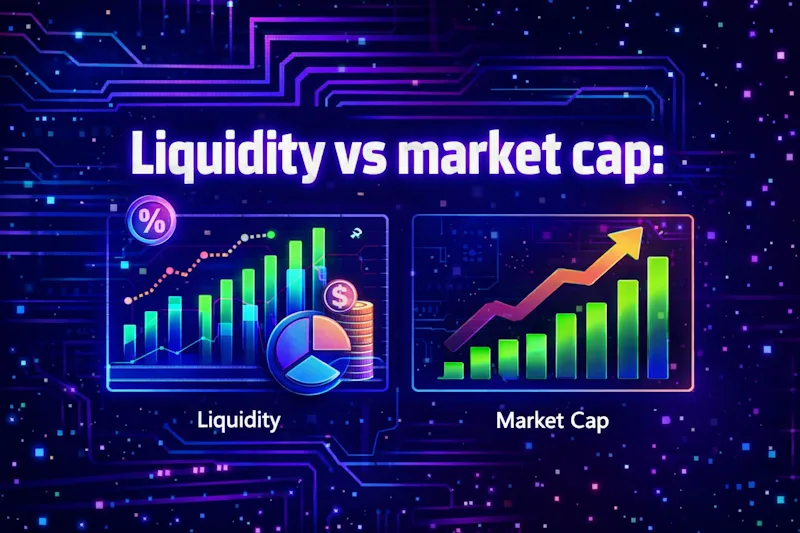
Liquidity vs Market Cap: Why Size Doesn’t Reflect Tradability
Having a high market capitalization doesn’t necessarily mean you can easily buy or sell the asset. Liquidity refers to the conditions surrounding trading, not capitalization.
Traders should look at the following in relation to market capitalization:
– Bid-Ask Spread
– Depth of the order book
– Distribution of volume
Maureen O’Hara, Robert W. Purcell Professor of Finance at Cornell, has long argued that market design shapes liquidity and price discovery. In crypto terms, spread, depth, and venue quality explain tradability better than capitalization alone.
The capitalization might be high, but the conditions for trading might not be favorable.
Volume vs Market Cap in Coin Analysis Before Entry
In terms of analysis prior to entry, both volume and market capitalization can be viewed as filters.
Step-by-step approach:
1. Determine asset size using market capitalization.
2. Verify if trading volume confirms asset size.
3. Examine asset liquidity on exchanges.
4. Examine asset price behavior.
Only after this analysis can we call an asset active, inactive, crowded, or illiquid.
What to Check Before Buying a Coin
A step-by-step approach is necessary for better decision-making.
– Check market capitalization and circulation volume.
– Examine 24-hour volume and trend.
– Compute turnover ratio and compare with similar assets.
– Examine exchanges and spreads.
– Compare market capitalization with fully diluted valuation.
This helps filter out bad opportunities early.
How to Read Common Metric combinations
It is better to analyze combinations of metrics rather than individual ones.
Common combinations and their meanings:
– High market capitalization and low volume. Asset is active but has low trading volume.
– Low market capitalization and high volume. Asset is inactive but is gaining traction.
– Increasing asset price and constant volume. Asset price is rising but trading volume is constant.
– Increasing volume and constant asset price. Asset volume is increasing while asset price remains constant.
When Metrics Send a False Signal
False signals are sent when market structure is ignored.
The problem with market structure
There are a few problems that can arise when using this model.
– Low free float can cause market capitalization to be inflated.
– Artificially inflated volume can cause incorrect conclusions.
– Volume concentrated on a single exchange can cause fragility.
– Spreads can cause poor asset execution.
Understanding market structure is important.
Common Mistakes When Comparing Market Cap and Volume
There are a few mistakes that people make when using this model.
– Value is determined only by price per coin.
– Assuming market capitalization accurately represents the amount of capital invested.
– Treating volume as a guarantee of liquidity.
– Ignoring the quality of exchanges and the possibility of wash trades.
– Confusing circulating market capitalization with fully diluted value.
By avoiding these pitfalls, the reliability of analysis is greatly improved.
Final Take: How to Use Both Metrics Together
The following framework provides a clear understanding:
Market Capitalization: Size
Volume: Activity
Liquidity: Tradability
Using this framework in conjunction with supply data and exchanges provides a comprehensive view of the asset.
FAQ
Is a Coin Necessarily Safer if It Has a High Market Capitalization?
No, not necessarily. Although larger projects are probably better known, risks still exist, including the risks of volatility, dilution, and the exchanges themselves.
Can High Volume Indicate Poor Liquidity on Exchanges?
Yes. Volume is not necessarily a reliable indicator if it is skewed towards poor exchanges.
Why Is a Coin with a Low Price Still Very Expensive?
The price alone doesn’t tell the full story. The total amount of supply is not reflected in the price. A low price doesn’t necessarily mean it is cheap in the context of the total amount of supply.
What if the Price Is Rising but the Volume Is Stagnant for Several Days?
This could indicate poor participation in the market. Further analysis is required.
What Should I Compare Before Investing in a Token During the Hype Wave?
You should compare size, supply, volume, liquidity, and FDV. Hype is not necessarily a reliable indicator.
Why Do Market Capitalization and Fully Diluted Value Sometimes Differ by a Wide Amount?
This is because not all tokens are in circulation.